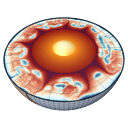
Two-phase flow of melt and solid
With cfg.twoPhaseFlow = true (default false) MILEVA treats partially molten mantle as two interpenetrating phases. The solid matrix creeps as before, the melt percolates through it by porous (Darcy) flow, and the matrix compacts or dilates to make room. The porosity validate! refuses every other combination (see Configuration).
Physical background
Why melt moves relative to the rock
Partial melt in the mantle sits along grain edges, where it forms a connected network of tubes already at a fraction of a per cent of melt. Basaltic melt is some 300 to 600 kg m
The permeability
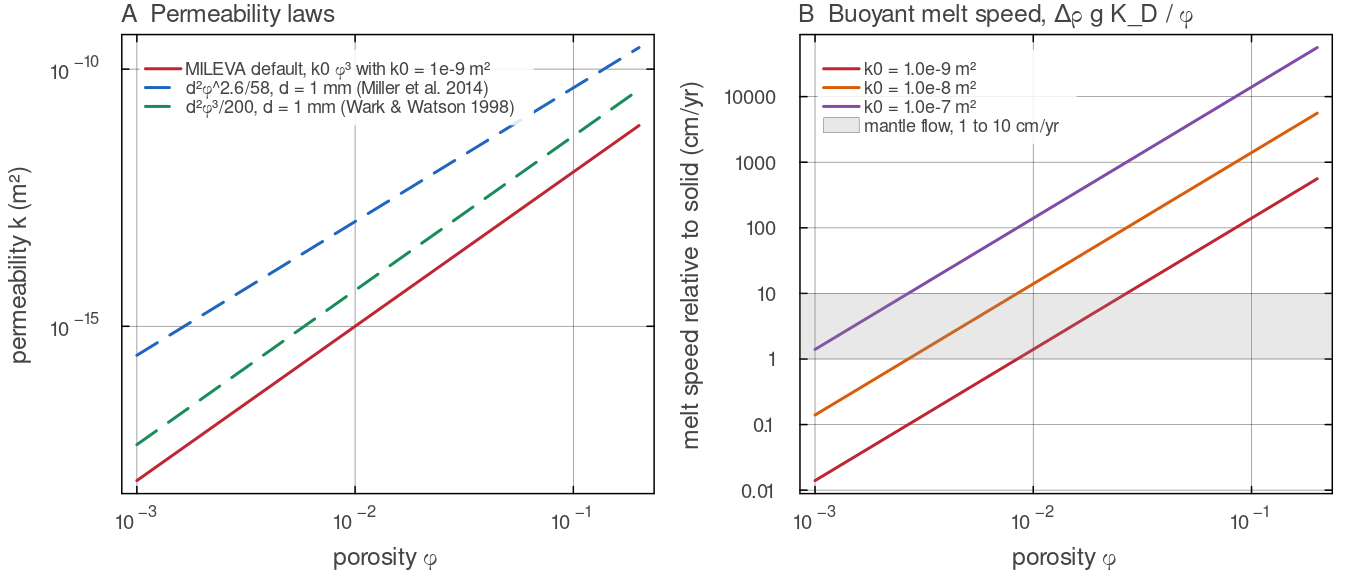
A: the default permeability darcy_mobility times docs/scripts/fig_two_phase_sections.jl.
Compaction
The melt can only leave if the matrix closes behind it, and it can only enter dry rock if the matrix opens. The solid is therefore compressible as a two-phase aggregate even though each phase is incompressible. The volume change of the matrix,
Theory and experiments place
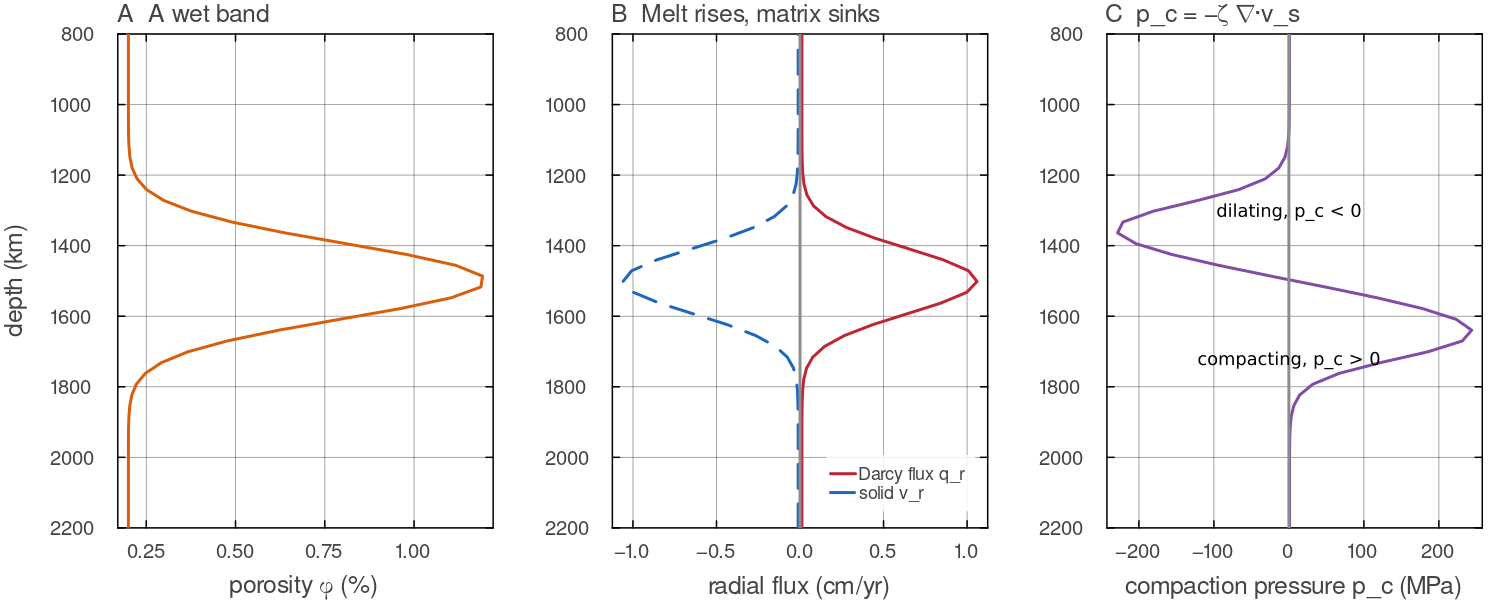
A laterally uniform column of the Venus-sized annulus (Nr = 96, Nt = 8, uniform 30.6 km cells, Boussinesq, MUMPS) with solve_stokes_darcy!; an operator illustration, not a run. A: the porosity. B: melt rises through the band at up to 1 cm yrdocs/scripts/fig_two_phase_sections.jl.
The compaction length
The balance of Darcy flow against matrix compaction defines a natural length, the compaction length (McKenzie 1984)
Over distances shorter than
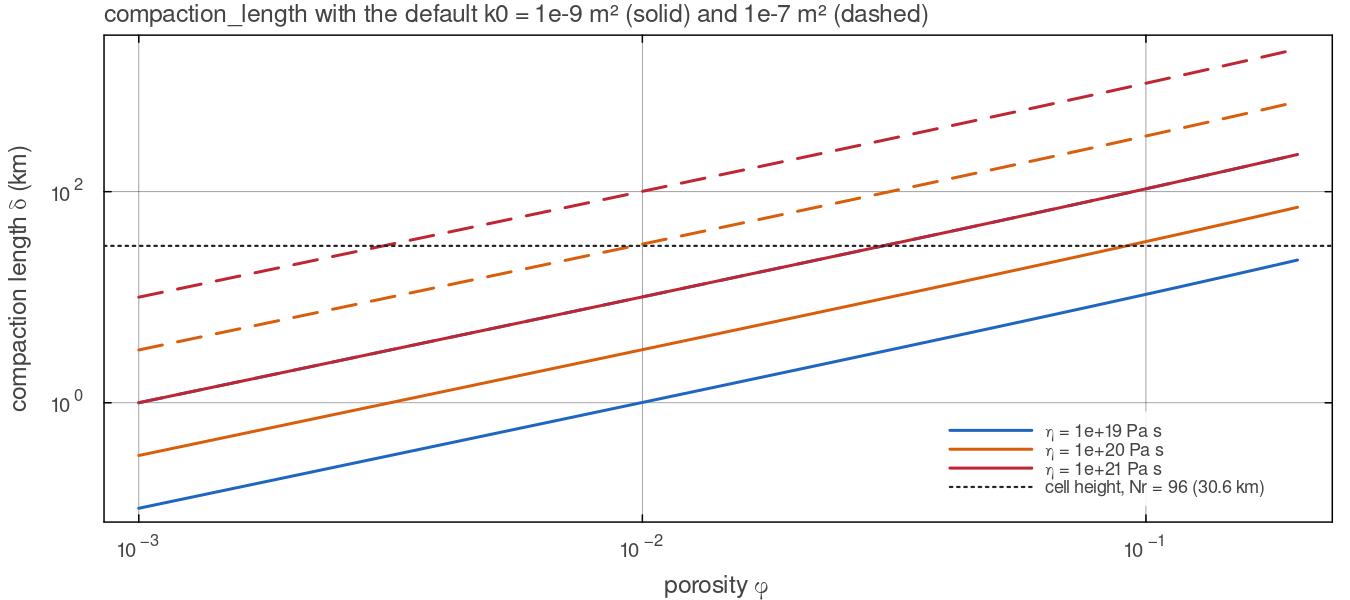
compaction_length with the default bulk-viscosity law (docs/scripts/fig_two_phase_sections.jl.
Porosity waves
A column of uniform porosity in which a local excess of melt is placed does not simply let it rise. The higher permeability lets melt into the matrix above, which must dilate, while the matrix below compacts behind it, and the excess travels as a solitary wave that keeps its shape (Barcilon & Richter 1986). For
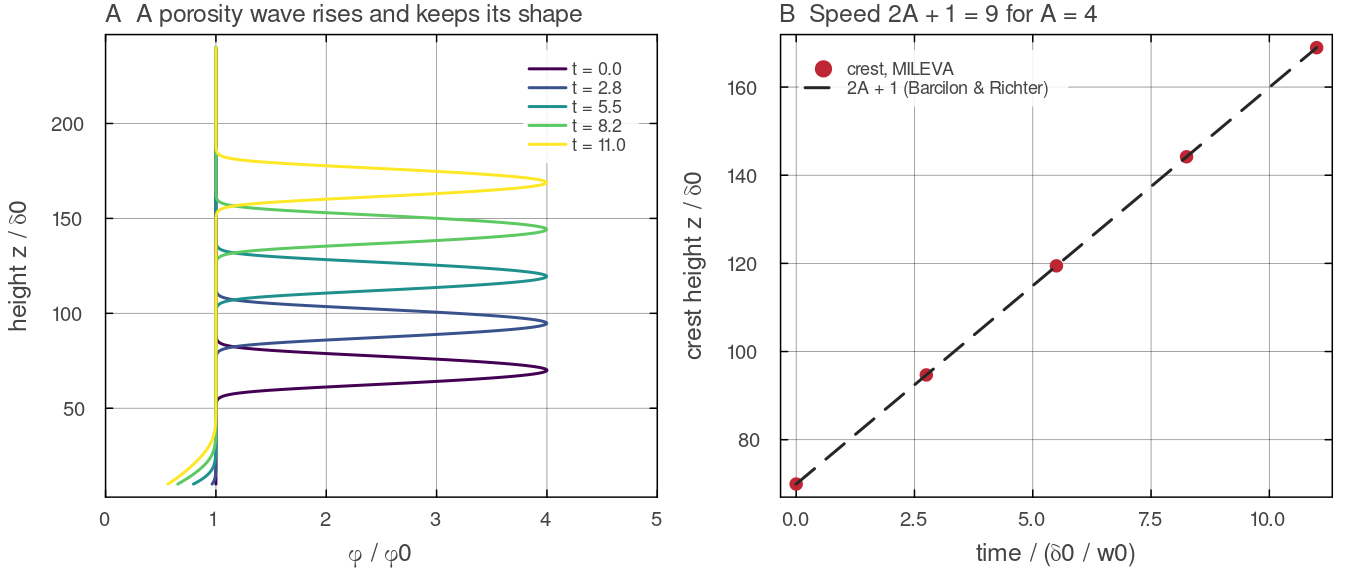
The finest solitary-wave run of benchmarks/two_phase_benchmarks.jl (amplitude output/two_phase_benchmarks/solitary_profiles.csv; heights and porosity are scaled by the background compaction length docs/scripts/fig_two_phase_sections.jl.
Typical values
| quantity | typical value | source |
|---|---|---|
| melt-solid density contrast, upper mantle | 300 to 600 kg m | Stolper et al. (1981) |
| melt viscosity, basalt | 1 to 10 Pa s | McKenzie (1984) |
| permeability law | Miller et al. (2014) | |
| permeability law | Wark & Watson (1998) | |
| melt weakening | Mei et al. (2002); Hirth & Kohlstedt (2003) | |
| bulk viscosity | Simpson, Spiegelman & Weinstein (2010) | |
| compaction length, | 1 to 10 km | this page, |
| melt fraction retained in the source | about 0.1 to 2 % | McKenzie (1984); Kohlstedt & Holtzman (2009) |
Symbols used on this page
| symbol | meaning | unit |
|---|---|---|
| porosity, the volume fraction of melt | - | |
| solid and melt velocity | m s | |
| Darcy flux | m s | |
| melt (fluid) pressure and compaction pressure | Pa | |
| the solved fluid pressure, | Pa | |
| shear viscosity of the dry matrix (from the rheology) and after melt weakening | Pa s | |
| bulk (compaction) viscosity | Pa s | |
| permeability, its prefactor and exponent, | m | |
| melt viscosity | Pa s | |
| Darcy mobility | m | |
| compaction length | m | |
| melt-solid density contrast | kg m | |
| segregation density, the density difference that drives the Darcy flux | kg m | |
| melt-weakening exponent | - | |
| bulk-viscosity factor and exponent, | -, - | |
| melting rate (negative for freezing) | kg m | |
| deviatoric stress and strain rate of the matrix | Pa, s | |
solid buoyancy from compute_buoyancy, a lateral density anomaly times | N m | |
| reference density, thermal expansivity, specific heat, latent heat, gravity | ||
| melt fraction, depletion, fusible fraction and solidus rise of Melting | ||
| discrete divergence (cells from faces) and gradient (faces from cells) | ||
| cell volume | m |
Equations
MILEVA solves the three-field form of the McKenzie (1984) equations (solid velocity, fluid pressure, compaction pressure) in the Boussinesq form used for magma-dynamics benchmarks (Keller, May & Kaus 2013). Both phases are incompressible and share one reference density
Material laws
The bulk viscosity
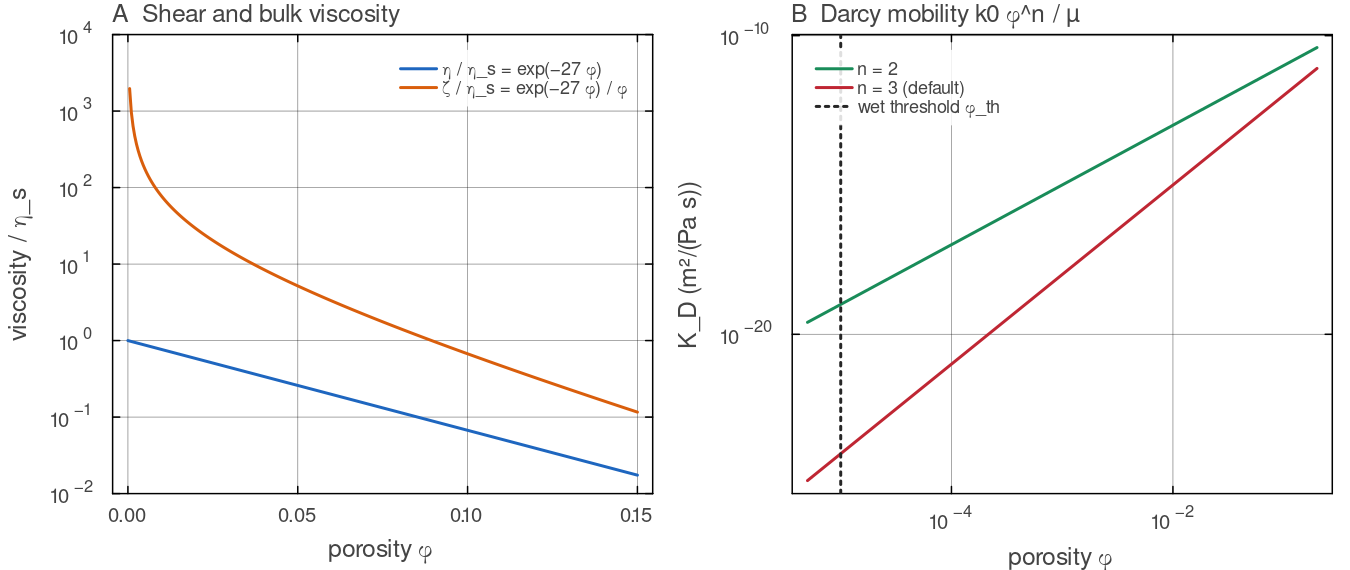
The material laws with the default parameters. A: melt_weaken! (inv_bulk_viscosity (darcy_mobility for cfg.twoPhasePorosityThreshold a cell is dry. Script: docs/scripts/fig_two_phase_sections.jl.
Field equations
The total stress of the mixture is
with
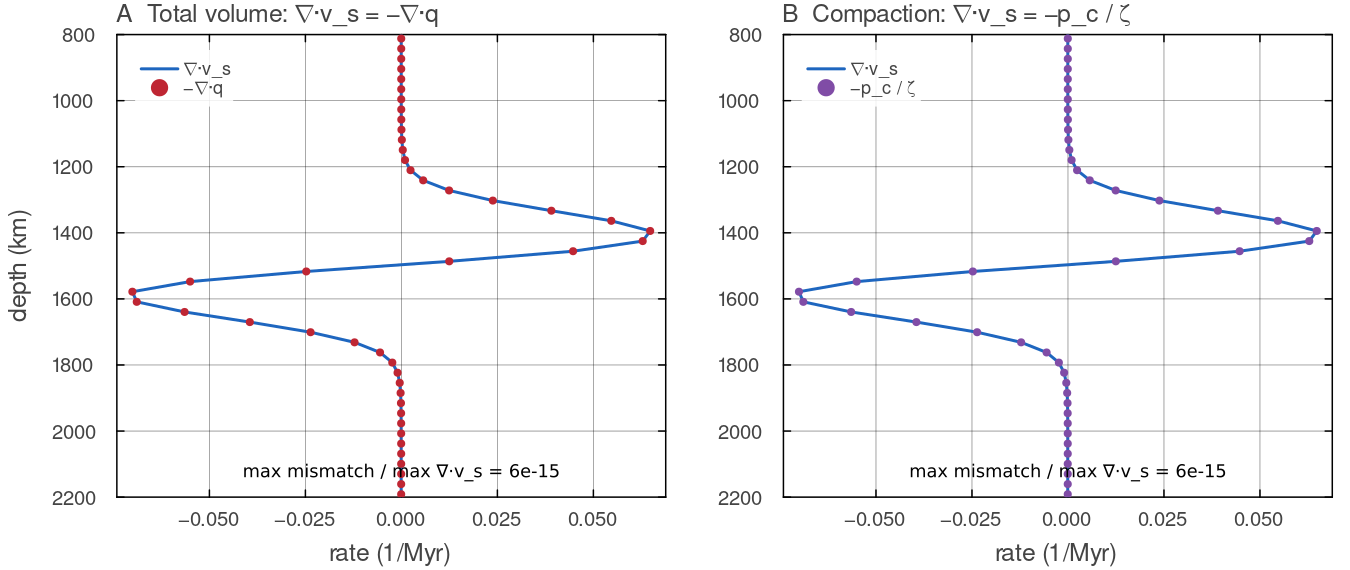
A laterally uniform column of the Venus-sized annulus (Nr = 96, Nt = 8, uniform 30.6 km cells, Boussinesq, MUMPS) with solve_stokes_darcy!; an operator illustration, not a run. A: the divergence of the solid velocity and minus the divergence of the Darcy flux, per cell. B: the same divergence and docs/scripts/fig_two_phase_sections.jl.
Buoyancy and the segregation density
MILEVA's solid buoyancy compute_buoyancy is a lateral anomaly, in which the radial mean of each density term is removed and absorbed into the solved pressure. In single-phase flow that is harmless, because a purely radial body force is a pressure gradient. In two-phase flow the same pressure also drives the melt, so the absorbed hydrostat must be put back into the Darcy law. Writing
where compute_buoyancy subtracts (it records them through its mean_profile keyword). Melt and solid share
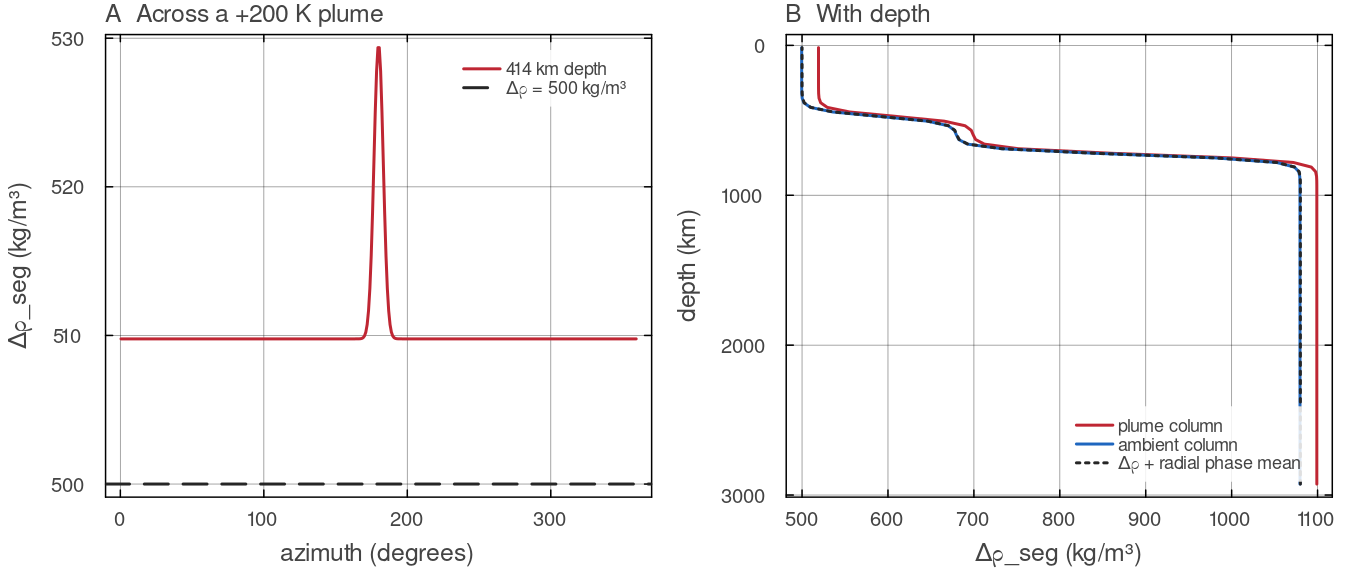
segregation_density on the Venus-sized annulus (Nr = 96, Nt = 384) for a temperature rising 0.3 K kmcompute_buoyancy through mean_profile (cfg.useClaperonBuoyancy = true). A: at 414 km the plume raises docs/scripts/fig_two_phase_sections.jl.
Energy
The mixture energy equation gains the heat carried by the melt relative to the solid,
so the extra source is darcy_heat_source). It is added to the diffusion solve beside the other volumetric sources, and the marker hand-back delivers it like every other source (see Temperature transport and time stepping). The latent heat of melting and freezing goes through the heat-pipe channel H_magma of Melting.
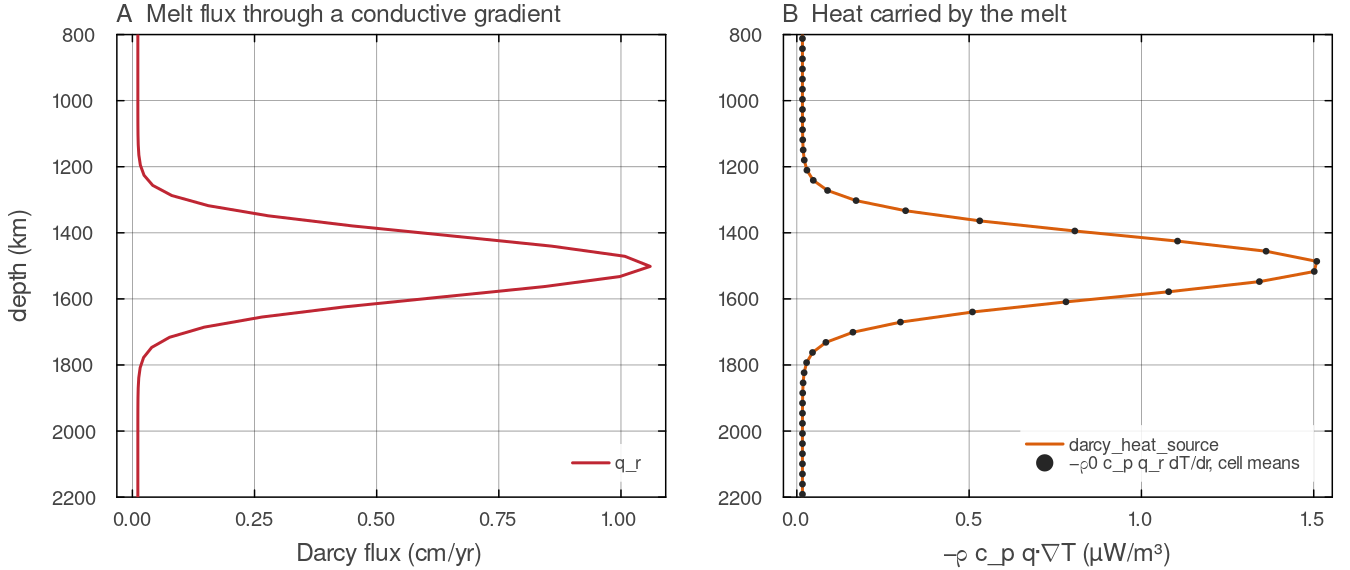
A laterally uniform column of the Venus-sized annulus (Nr = 96, Nt = 8, uniform 30.6 km cells, Boussinesq, MUMPS) with solve_stokes_darcy!; an operator illustration, not a run, with a linear temperature from 740 K at the surface to 4025 K at the CMB. A: the Darcy flux. B: darcy_heat_source (line) and docs/scripts/fig_two_phase_sections.jl.
How MILEVA discretises it
Unknowns and operators
The two-phase system lives on the staggered mesh of the Stokes solver:
so the first three blocks are index-identical to the single-phase system and _assemble_stokes_core (solvers/stokes_assembly.jl) supplies them, with the stress made trace free (trace_free = true). The continuity divergence and the pressure gradient are the pair the single-phase operator already uses,
with
The trace-free stress is the compressible deviator that the anelastic (ALA/TALA) path also uses; there is one implementation, switched on by trace_free in _viscous_block_deviatoric. It adds compute_strain_rate removes the same trace, so the strain rate the rheology reads is the deviatoric one.
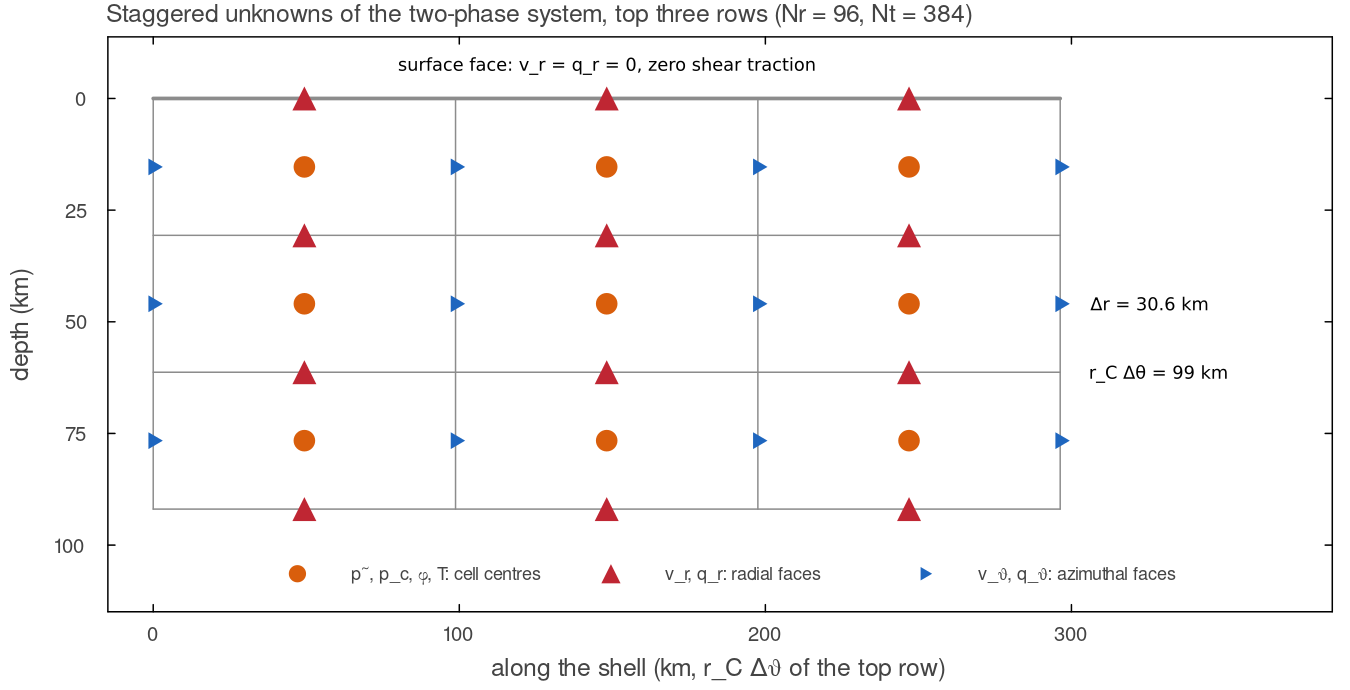
Where the unknowns live, drawn at the true cell sizes of the top three rows of the Venus-sized annulus at Nr = 96, Nt = 384 (docs/scripts/fig_two_phase_sections.jl.
The linear system
After the momentum rows are scaled as in single phase (
assemble_stokes_darcy in solvers/two_phase_assembly.jl:
Momentum.
is the deviatoric operator with the trace-free stress; the compaction pressure enters with the same coefficients as . Total volume.
, with the gravity term of the Darcy law on the right-hand side. is averaged onto each face. Compaction.
in wet cells ( = cfg.twoPhasePorosityThreshold, default). In dry cells the row is the identity , the exact limit, which keeps the matrix non-singular. Scaling. The existing non-dimensionalisation (shell depth, diffusivity, median viscosity
) is reused; then the same point pin and max-abs row equilibration as in single phase are applied.
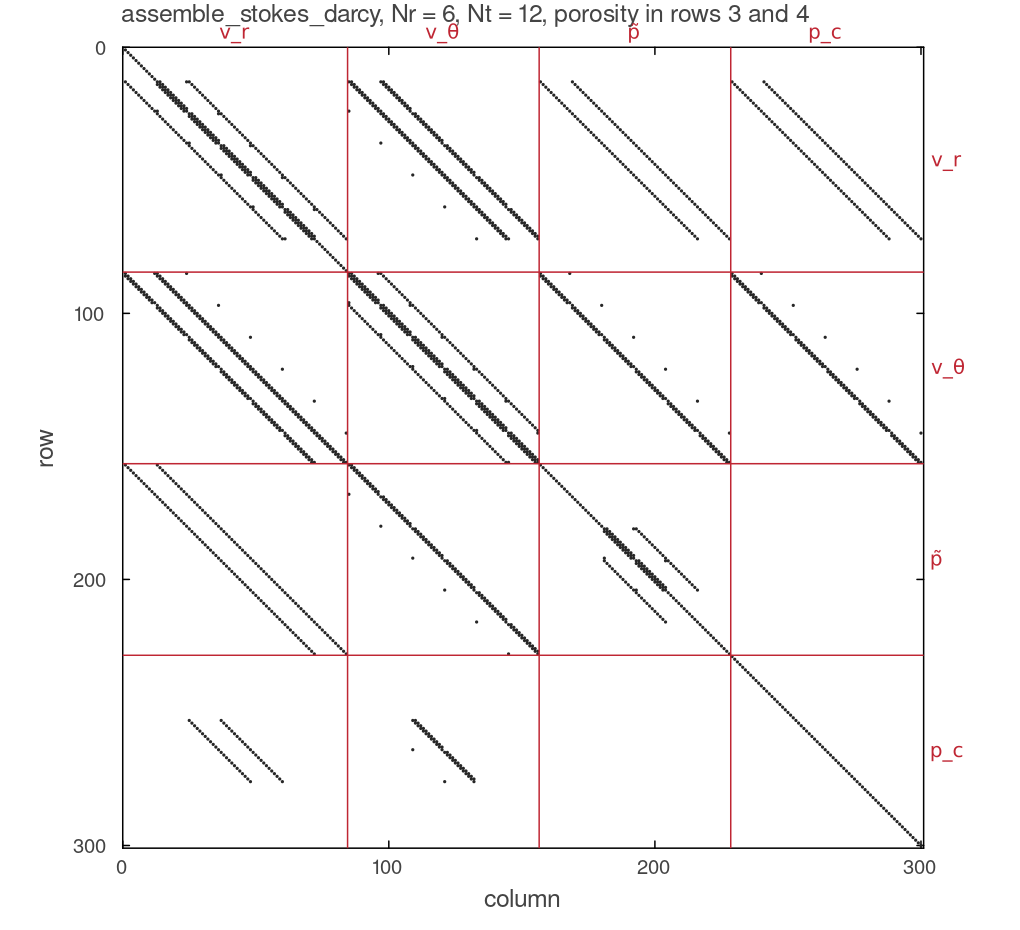
The non-zero pattern of assemble_stokes_darcy on a 6 by 12 annulus with porosity in rows 3 and 4 (300 unknowns, 2340 non-zeros), blocks in the order docs/scripts/fig_two_phase_sections.jl.
Face permeability
The Darcy flux lives where the velocity lives, face_mobility):
| neighbours | face mobility | why |
|---|---|---|
| both wet | arithmetic mean of | second order where the porosity is smooth |
| one wet, one dry | donor cell: | melt can enter dry rock, a dry cell cannot lose melt it does not have |
| both dry | 0 | |
| wall | 0 | no flux through the CMB or the surface |
The flow direction at a wet/dry face is the one of the previous solve (upward before the first). solve_stokes_darcy! refreshes the directions from the new flux and solves again until no wet/dry face flips, at most 10 solves. A solve that reaches the cap keeps its last solution, in which some wet/dry faces carry a flux against the direction their mobility was taken from. It is counted in donor_capped, those faces are counted in donor_mismatch, both appear in the [2-phase] log line (capped, mismatch), and a warning names them. The mobilities the returned flux was computed with are kept with it, so the time step reads the melt speed that flux actually implies. Arithmetic averaging would let a dry cell below a melting zone drain into it and go to negative porosity on every step; harmonic averaging would forbid melt from ever entering a dry cell, so a melt front could not advance.
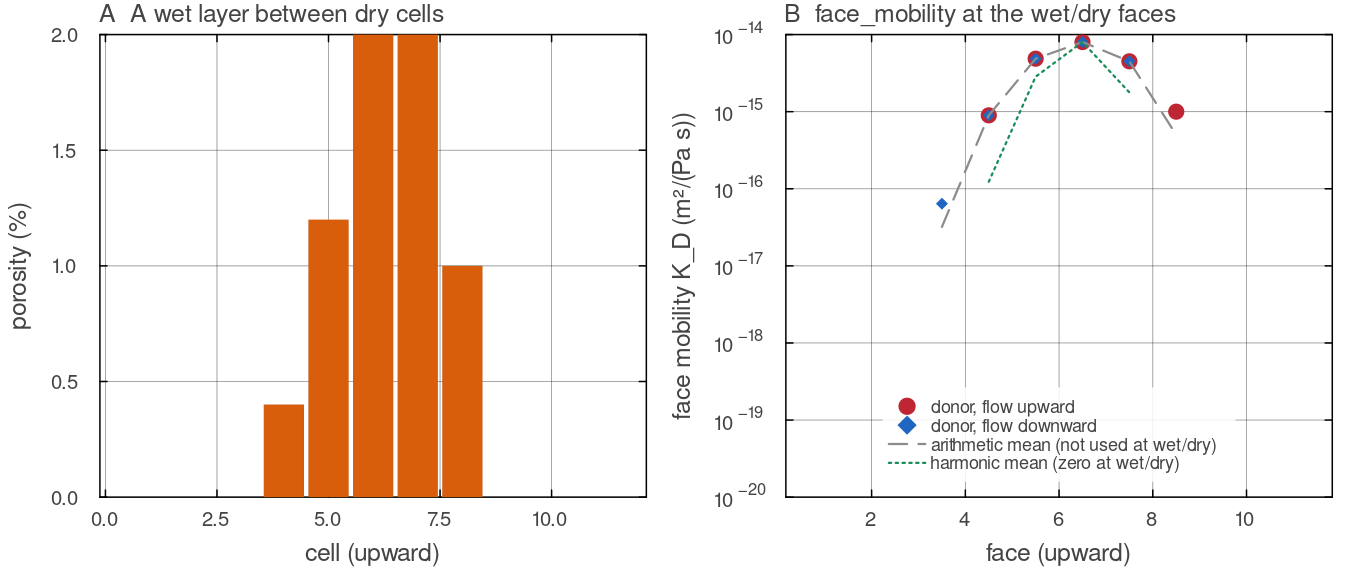
face_mobility on one column of eleven cells (default docs/scripts/fig_two_phase_sections.jl.
Boundary conditions and the pressure gauge
Free slip is unchanged:
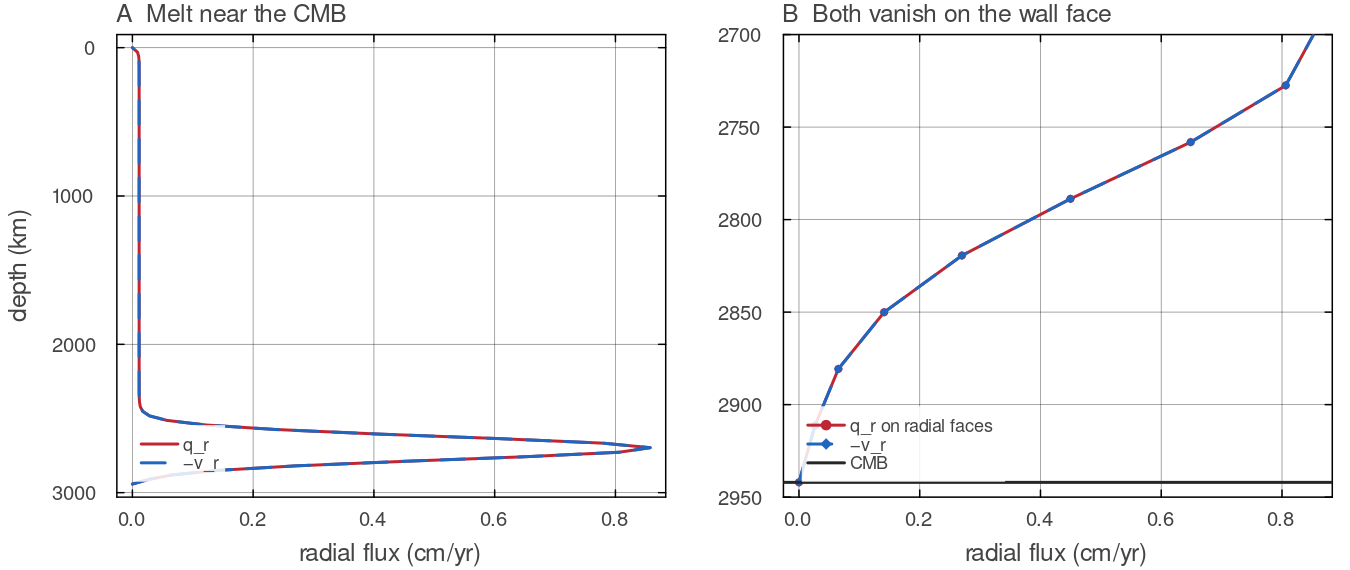
The column of the panels above with the band moved to 2700 km depth. A: docs/scripts/fig_two_phase_sections.jl.
Reduction to single-phase Stokes
With
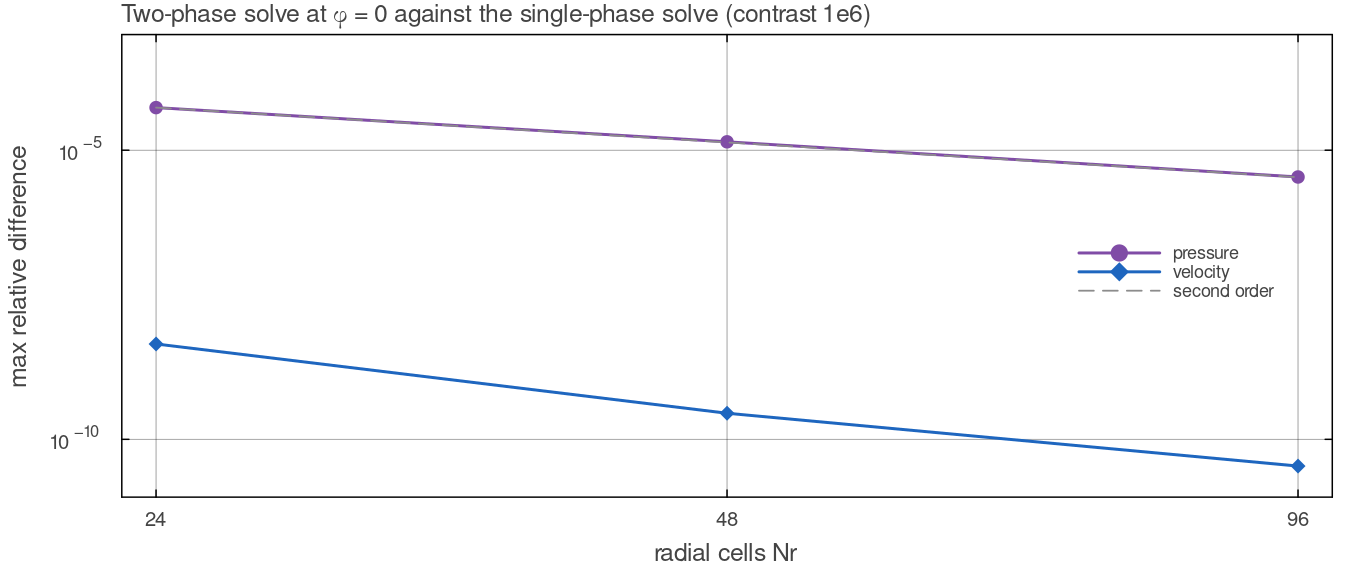
The variable-viscosity case of tests/test_two_phase.jl (contrast solve_stokes_mumps and by solve_stokes_darcy! at docs/scripts/fig_two_phase_sections.jl.
Solving
Every two-phase solve factorises afresh with MUMPS (solverType = "mumps") or UMFPACK ("direct"), twice per time step (see Porosity transport); a factor is valid only for the same viscosity, porosity and donor directions, which practically never recur between steps. Each solve is followed by one step of iterative refinement with the same factor. Where
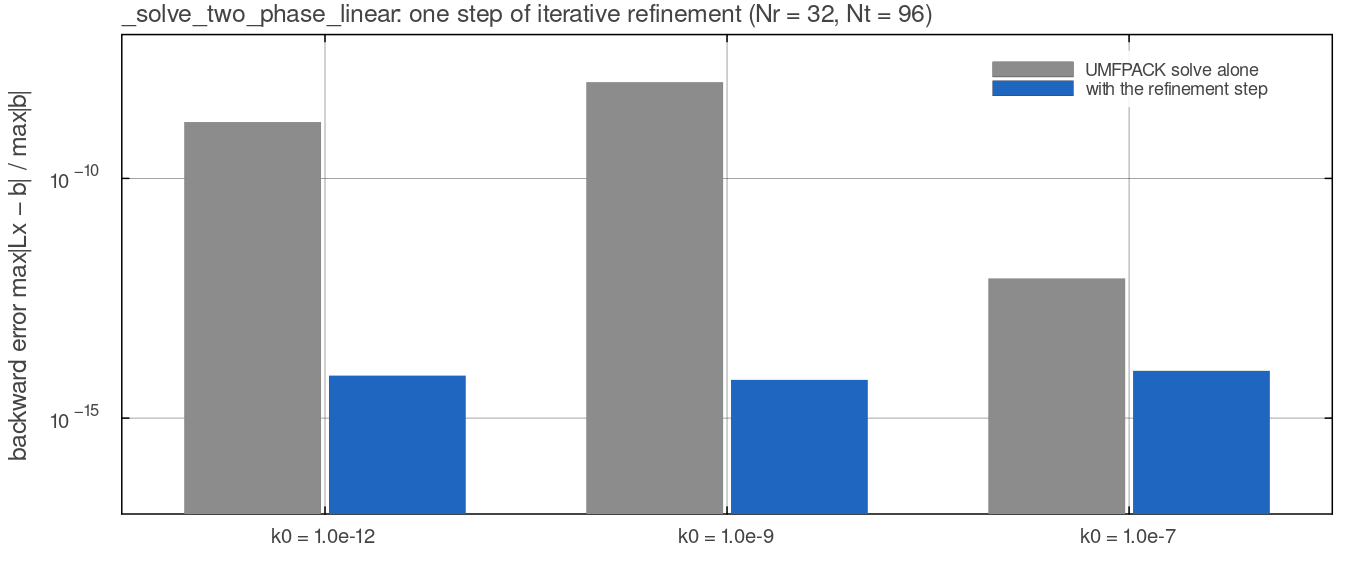
The field of the solver-accuracy test in tests/test_two_phase.jl (Nr = 32, Nt = 96, variable viscosity and porosity) on the Venus-sized annulus, assembled by assemble_stokes_darcy and solved by UMFPACK alone and by _solve_two_phase_linear with its refinement step. The backward error falls from docs/scripts/fig_two_phase_sections.jl.
Porosity transport
Porosity lives on the cells and is not carried by markers. Write the right-hand side of the porosity equation for a solid velocity
with the van Leer face reconstruction of the 2-D temperature advection in conservative form (zero-gradient wall ghost) and the solver's own divergence update_porosity! advances it with Heun's method, the two-stage strong-stability-preserving Runge-Kutta scheme (Shu & Osher 1988):
where
Both terms of
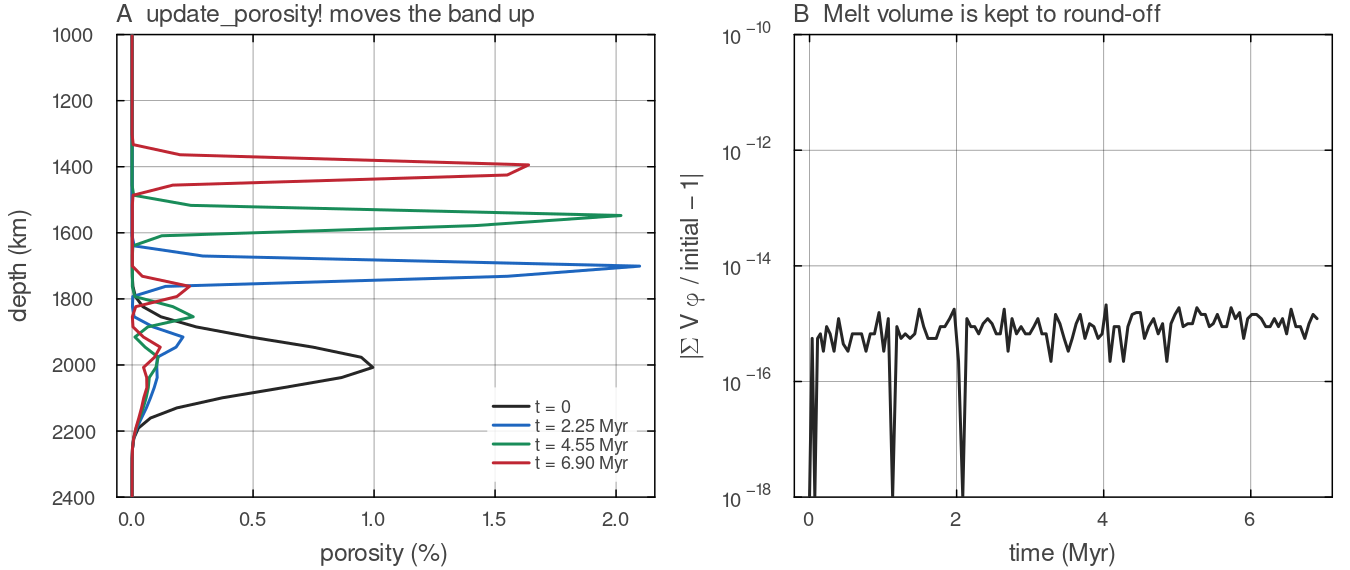
The column of the panels above with a band of 1 per cent porosity at 2000 km on a dry background, advanced by 120 steps of update_porosity! at the step of two_phase_dt, with a fresh solve_stokes_darcy! before each. A: the band rises into the dry rock above it and steepens at its front, leaving a thin tail. B: docs/scripts/fig_two_phase_sections.jl.
Time step
On top of the mantle CFL limit, two_phase_dt imposes, with cfg.twoPhaseCFL (0.5, the van Leer positivity bound),
the melt CFL condition on every face that carries Darcy flux, the CFL condition of the heat carried by the melt, and a compaction limit that keeps a compacting cell from losing more than half its melt in one step.
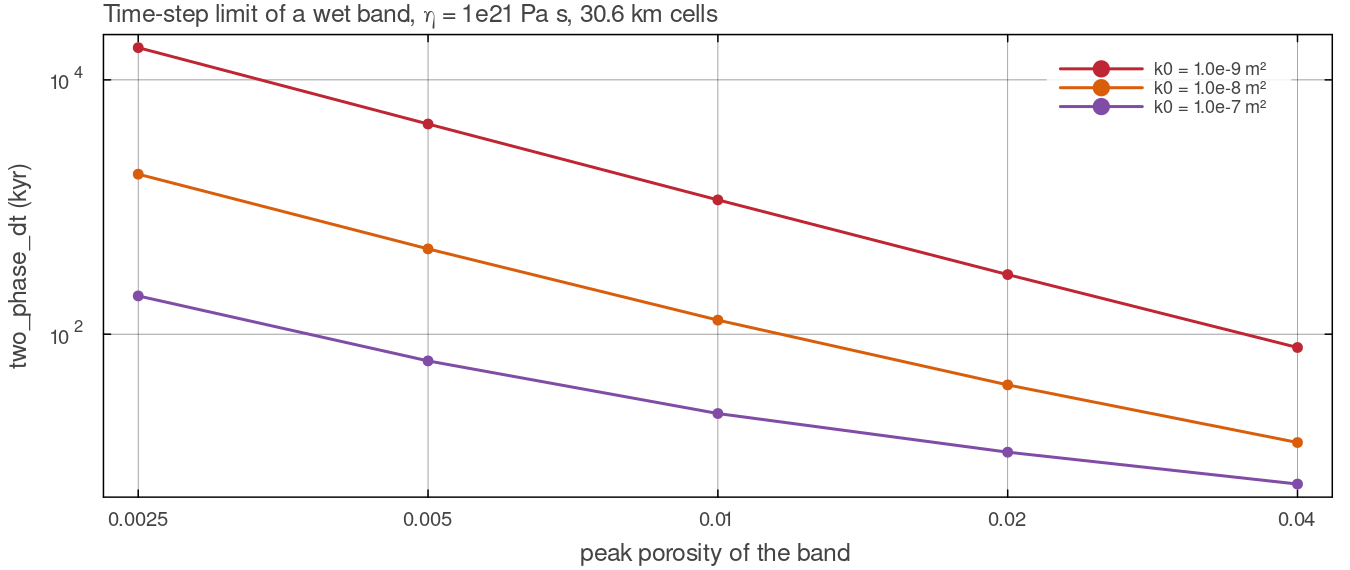
two_phase_dt after one solve_stokes_darcy! on the column of the panels above with a dry background, for peak porosities of 0.25 to 4 per cent and three values of docs/scripts/fig_two_phase_sections.jl.
Melting and freezing
With cfg.trackBasalt on, melt_two_phase! (physics/two_phase.jl) replaces basalt_evolution! and returns the same quantities, so the time loop uses either. It melts and freezes to equilibrium every step, so the rates do not depend on the step length:
- Melting, on markers shallower than
cfg.meltExtractMaxDepth_km. The increment is the melt fraction that leaves the parcel on its depletion-raised solidus after paying its latent heat (Katz 2008),
capped at the remaining fusible fraction
Melt into the porosity.
over the cell's markers, with the marker weights. Freezing, on cells that did not melt in the same call, hold melt and lie below their solidus (with the cell-mean depletion), again to equilibrium. The amount frozen is the volume whose latent heat brings the cell back to its solidus,
. The fraction cfg.eruptionEfficiencyof it erupts to the top populated cell of the column (stamping the surface age); the rest becomes basalt on the cell's own markers, with overflow through the cascade and per-column backlog of Melting. Intrusions therefore form where transported melt meets cold rock, not in a prescribed depth band.Heat, returned as the temperature tendency
H_magma. Melting removesper unit melt volume produced, freezing in place releases it, and the erupted melt removes its sensible heat from its source (its latent heat was paid when it melted).
The ledger reports melt produced, erupted and frozen in place through the existing melt columns of the diagnostics. Without trackBasalt nothing melts and the porosity evolves from cfg.initialPorosity alone. Heat-producing elements stay on the markers; partitioning them into the melt is refused rather than dropped.
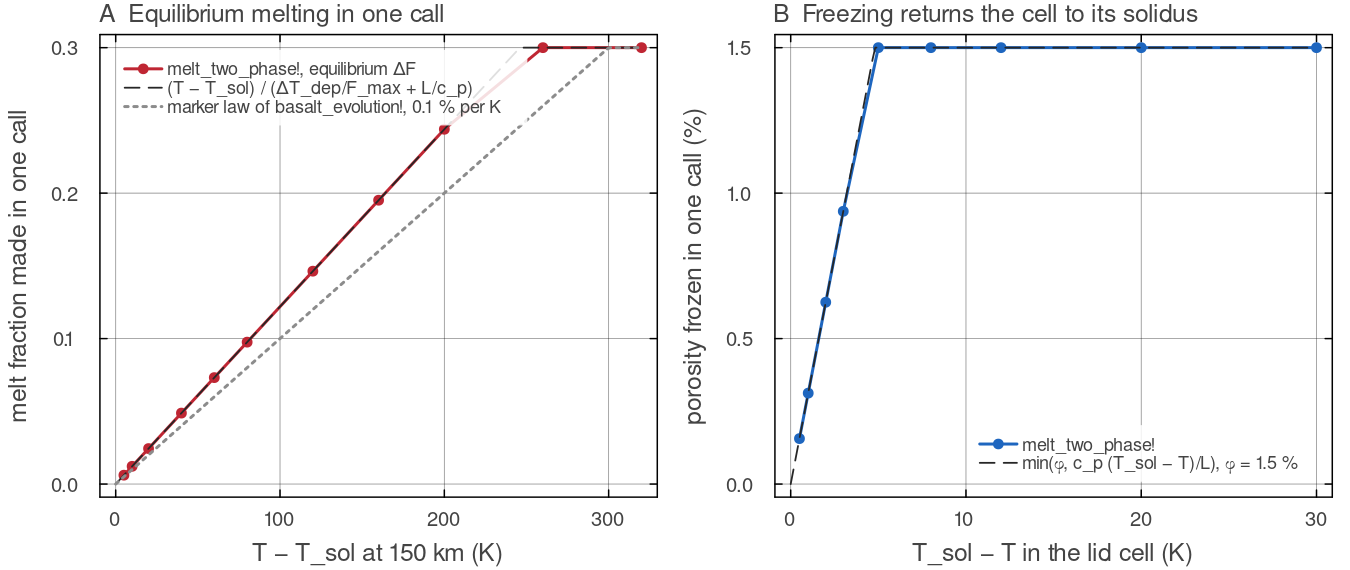
melt_two_phase! on the Venus-sized annulus (Nr = 96, Nt = 384) for eleven fertile melting cells at 150 km and nine lid cells at 107 km holding 1.5 per cent melt, each the only active cell of its column. A: the equilibrium increment follows docs/scripts/fig_two_phase_sections.jl.
How it is computed
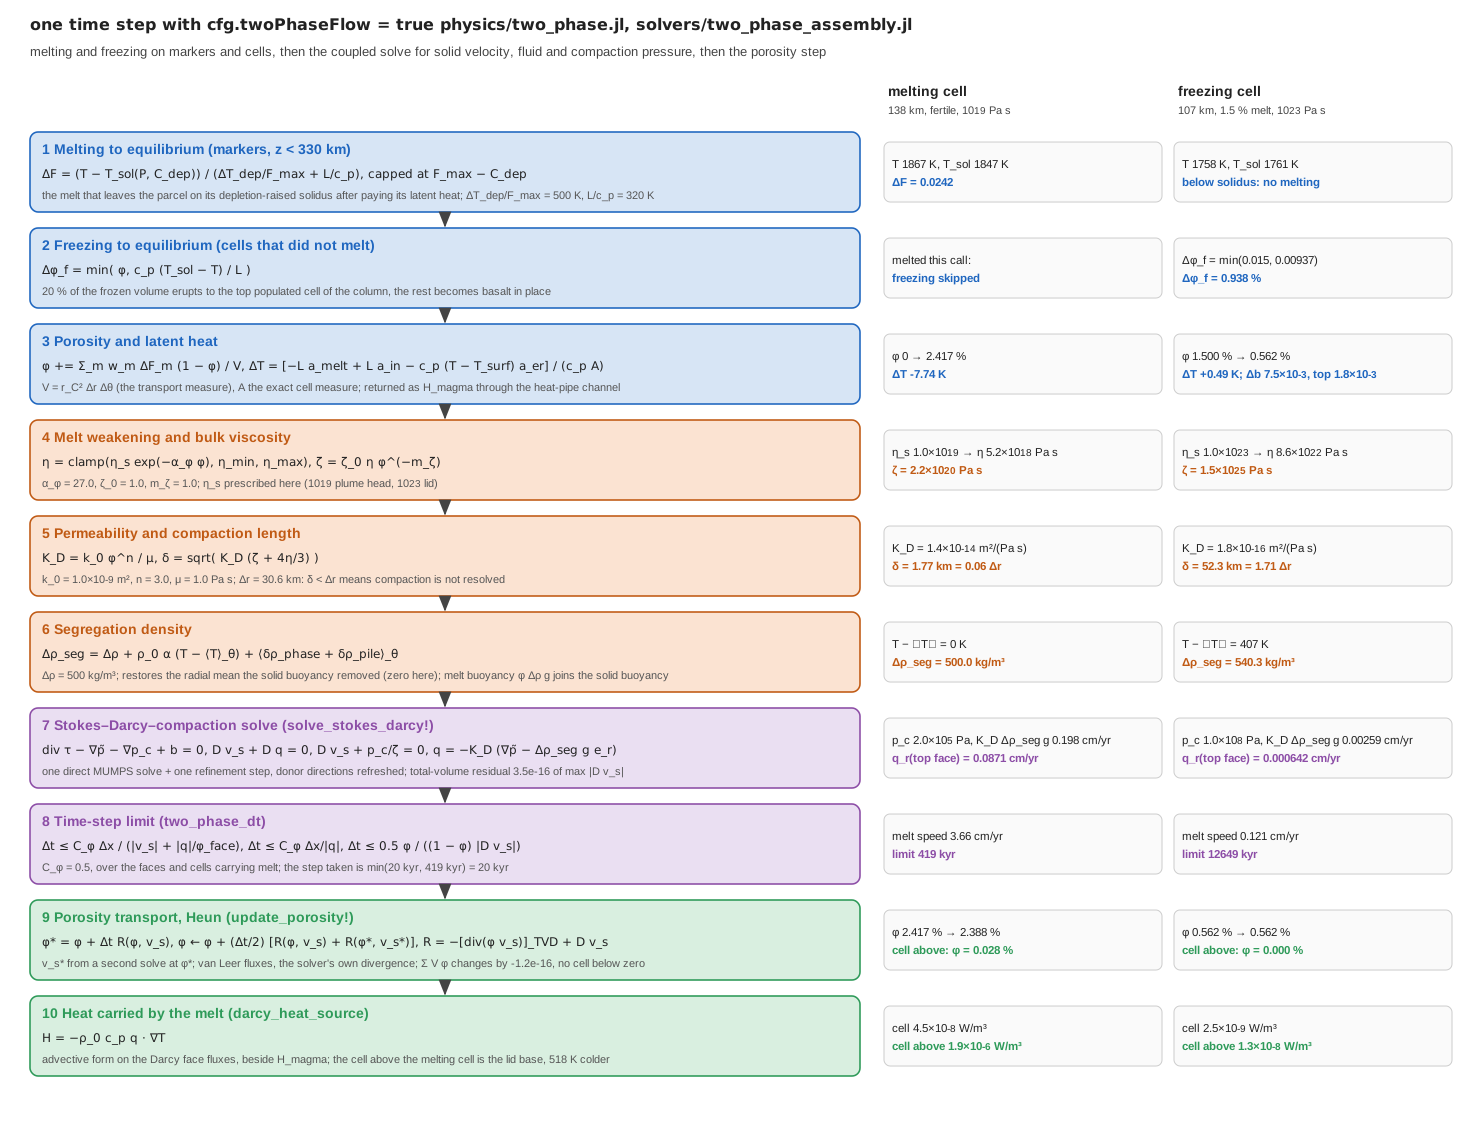
One time step with cfg.twoPhaseFlow = true on a Venus-sized annulus (Nr = 96, Nt = 384, uniform 30.6 km cells, Boussinesq, MUMPS) with a prescribed viscosity of docs/scripts/fig_two_phase_pipeline.jl.
Verification
Three benchmarks with closed-form or exact discrete references are in benchmarks/two_phase_benchmarks.jl (CSVs in output/two_phase_benchmarks/, figures by docs/scripts/fig_two_phase.jl); tests/test_two_phase.jl guards them on small grids together with the properties below.
Compaction boundary layers, exact spherical solution
A laterally uniform column with constant
with
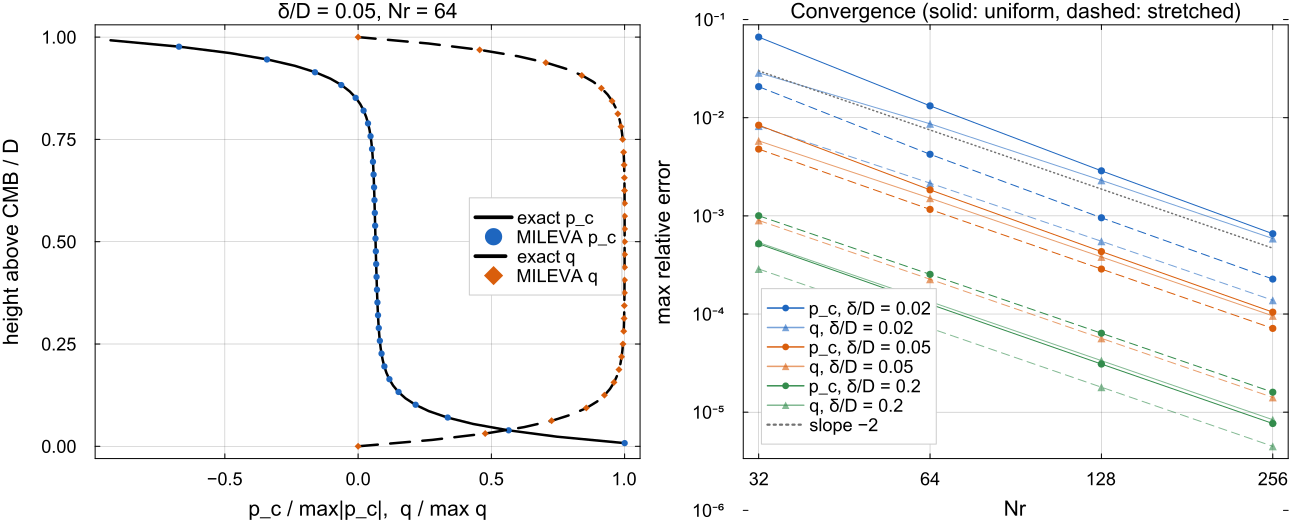
Left: compaction pressure and Darcy flux at
The error falls at second order (observed orders 2.0 to 2.3 in
Magmatic solitary wave
A wave of amplitude
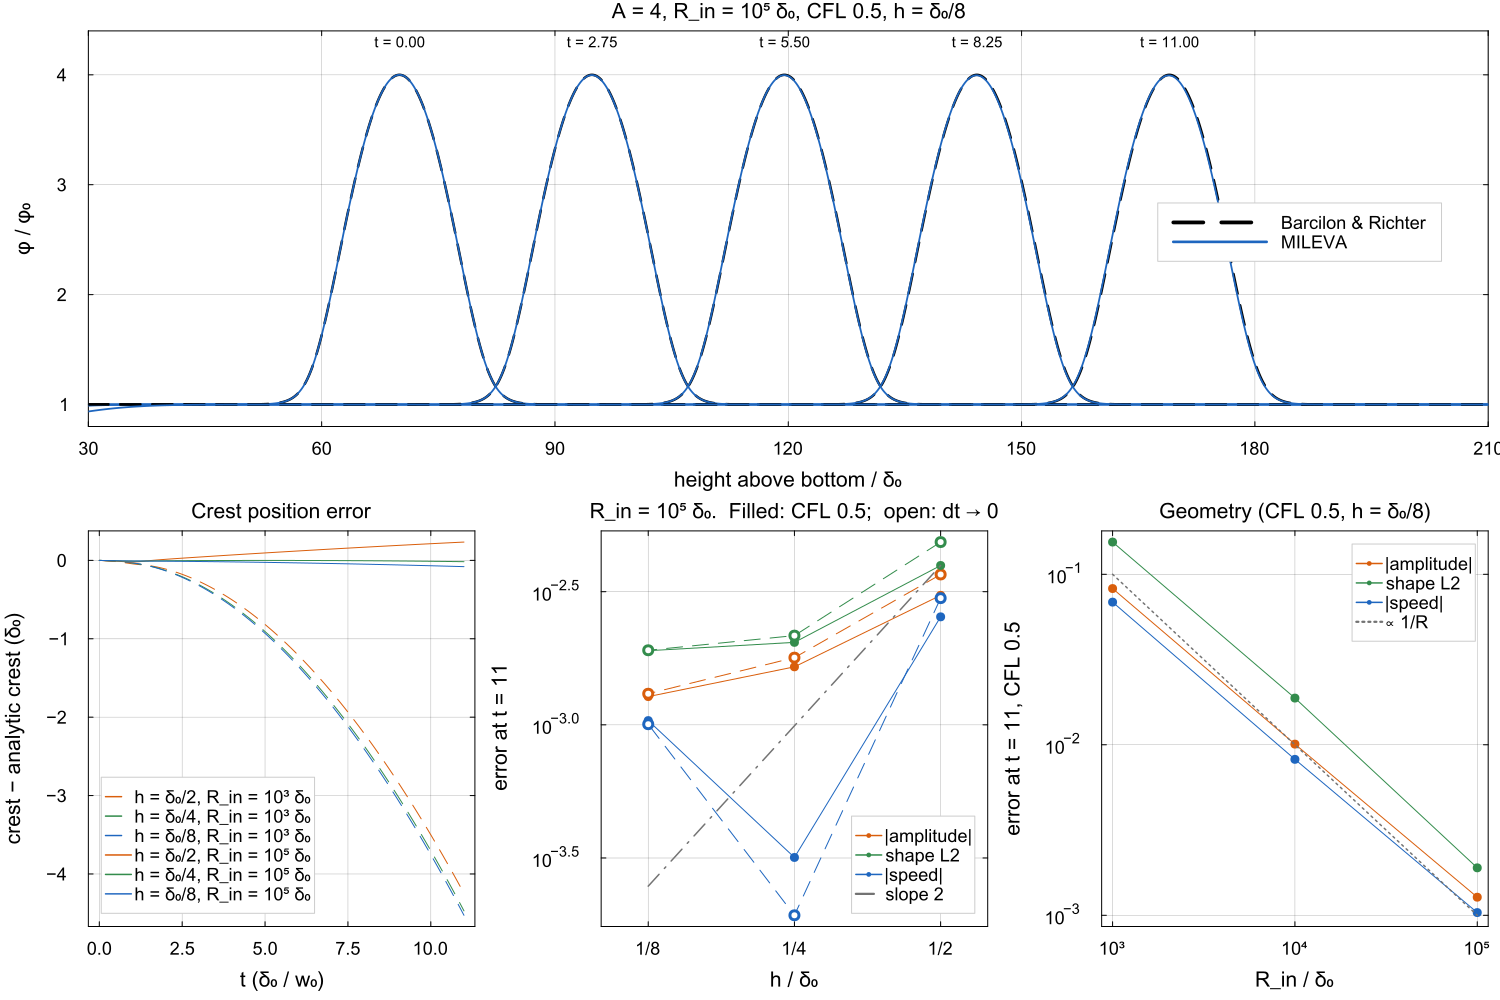
Top: the wave at five times at
The porosity step was forward Euler until 2026-10; it is now Heun's method (Porosity transport). Both at
| amplitude error, forward Euler | +13.7 % | +6.7 % | +3.3 % |
| amplitude error, Heun | −0.31 % | −0.17 % | −0.13 % |
| speed error, forward Euler | +1.7 % | +0.71 % | +0.28 % |
| speed error, Heun | +0.25 % | −0.032 % | −0.10 % |
| shape error (L2), forward Euler | 0.22 | 0.11 | 0.052 |
| shape error (L2), Heun | 0.0040 | 0.0020 | 0.0019 |
Forward Euler grew the crest by 3.3 % at
Melt volume, positivity and infiltration
A Gaussian melt blob (peak 2 %, cut to zero below
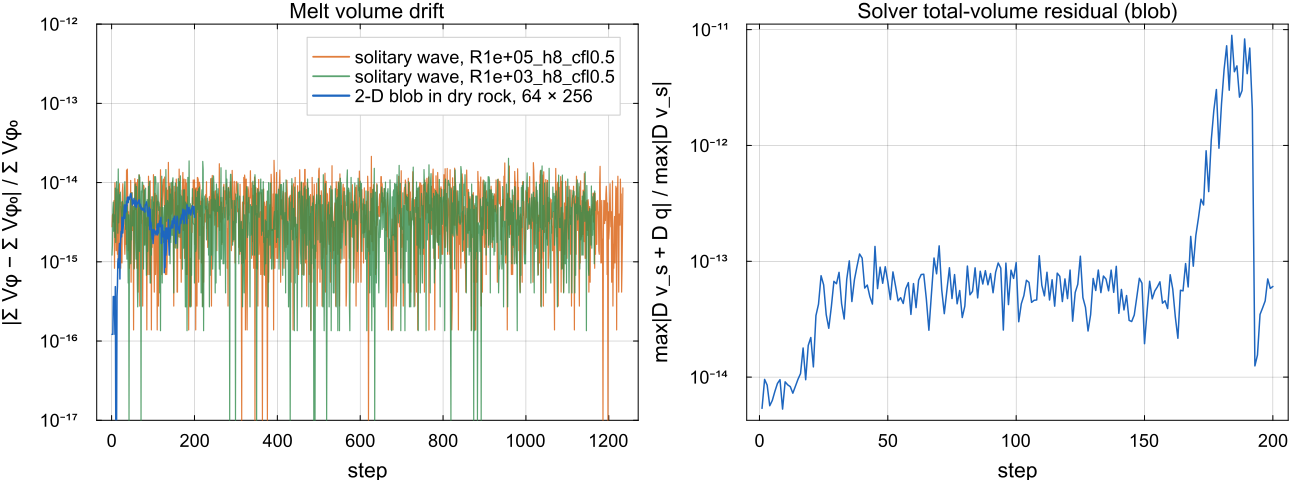
Left: relative change of the melt volume
The melt volume drifts by at most
Further properties guarded by the test suite
| property | measured |
|---|---|
| work equals dissipation: | ratio 1.0041 and 1.0066 at Nr = 32, 1.0011 and 1.0024 at Nr = 64, for contrasts |
| solver accuracy on weak compaction rows ( | backward error |
melt_two_phase! ledger | porosity, basalt, depletion and heat close against the ledger |
| time loop with two-phase flow, checkpoint and resume | completes; melt volume conserved to |
| flag off | the existing suite passes, and the single-phase matrix and right-hand side (Boussinesq, ALA and TALA), temperature advection, buoyancy, strain rate and a 20-step time loop hash identical to the code without two-phase flow |
Resolution
Compaction-scale structure, the boundary layers, porosity waves and channels, is represented only where the compaction length spans several cells. The log line [2-phase] prints the largest compaction length over wet cells in units of the finest radial cell (delta_max/dr_min). With the default
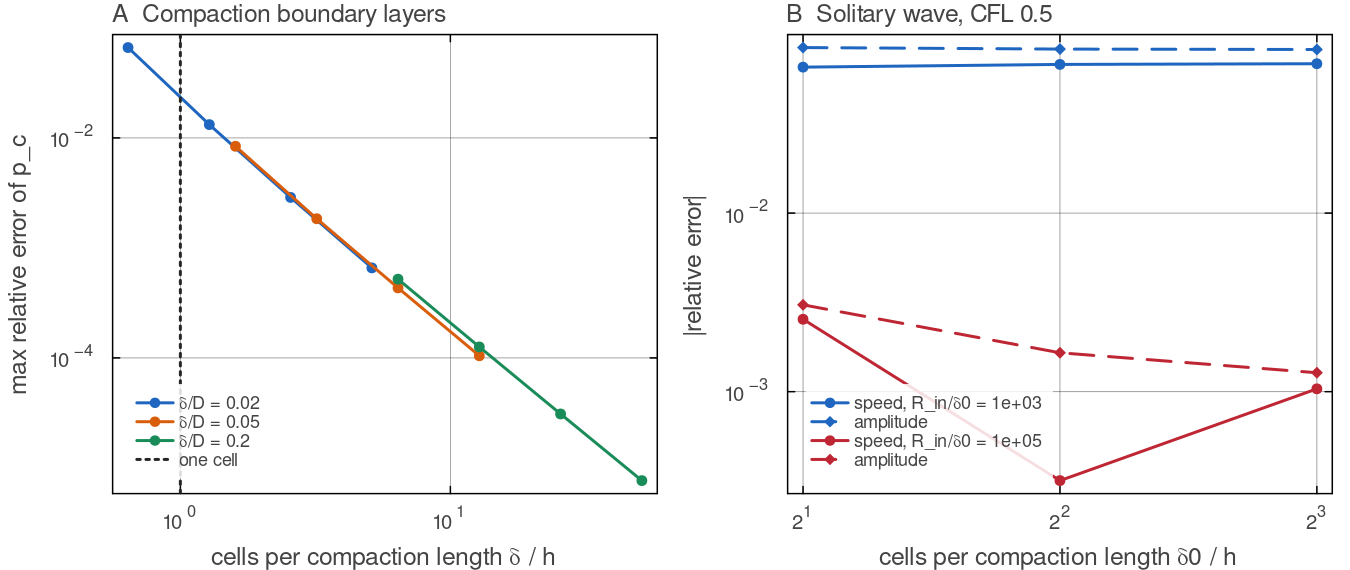
Replotted from the benchmark CSVs of benchmarks/two_phase_benchmarks.jl (compaction_convergence.csv, solitary_runs.csv, uniform grids). A: the maximum error of docs/scripts/fig_two_phase_sections.jl.
Configuration
| field | default | unit | meaning |
|---|---|---|---|
cfg.twoPhaseFlow | false | master switch | |
cfg.meltDensityContrast | 500 | kg m | |
cfg.meltViscosity | 1 | Pa s | |
cfg.permeabilityK0 | m | ||
cfg.permeabilityExponent | 3 | ||
cfg.meltWeakeningAlpha | 27 | ||
cfg.bulkViscosityFactor | 1 | ||
cfg.bulkViscosityExponent | 1 | ||
cfg.twoPhasePorosityThreshold | |||
cfg.twoPhaseCFL | 0.5 | ||
cfg.initialPorosity | 0 | uniform porosity at a fresh start |
validate! refuses twoPhaseFlow with a 3-D grid, a geometry other than "spherical_annulus", a solver other than "direct" or "mumps", a compressibility mode other than "Boussinesq", radioHeatPartitionD > 0, meltSegregationMovesMarkers, useStickyAir, useDeviatoricStress = false, useVelocityLimit = true (the limiter rescales the solid velocity but not the Darcy flux or the compaction pressure), pPen other than 0 (the penalty would sit on the total-volume rows), useAntisqueeze (the matrix compacts physically, so the squeeze trigger would fire on every compacting cell), and, with trackBasalt, useHeatPipe = false or useMagmaOceanFreezing = true. Each refusal names its reason. meltExtractionTime_yr and intrusionDepth_km are not read in two-phase mode.
Output. VTK files gain Porosity, FluidPressure, CompactionPressure and DarcyFlux; diagnostics.csv gains melt_volume_m3rad, phi_max, neg_phi_cells, neg_phi_volume_m3rad, q_max_cmyr, mass_resid, compaction_resid and donor_capped, only when the flag is on, so the CSV of a single-phase run is unchanged. Checkpoints carry the porosity and the donor directions; a resume with twoPhaseFlow from a checkpoint without them is refused.
Assumptions and simplifications
Boussinesq, one temperature. Both phases are incompressible with one reference density, the melt-solid density contrast is constant, so melt is buoyant wherever it exists (melt is produced only above
meltExtractMaxDepth_km), and melt and matrix are in thermal equilibrium.The rest of the step stays first order. The porosity is advanced to second order in time, but the temperature, the markers and the melting coupling use the solid velocity and Darcy flux of the solve at
, and the second solve reuses the viscosity of the step with only the melt weakening moved to . Heat-producing elements stay on the markers, and the melt carries no trace elements.
Solid markers keep fixed weights while the matrix compacts, an error of second order in the porosity.
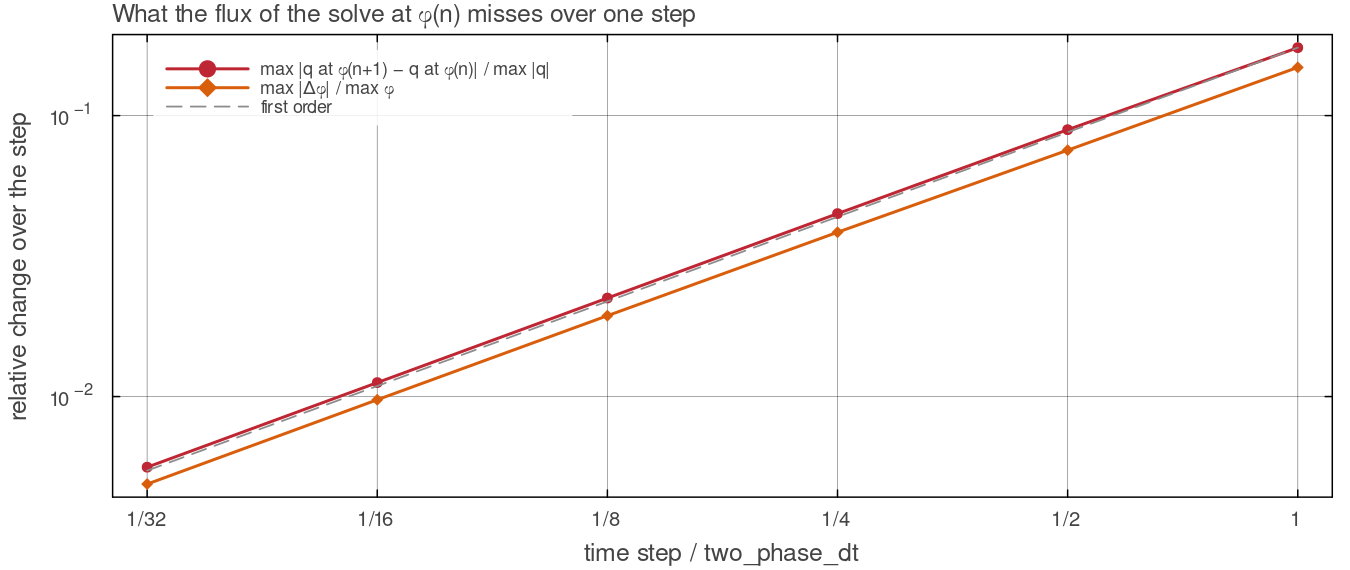
What using the solve at update_porosity! step of a given fraction of two_phase_dt and solved again: the Darcy flux changes by 17 per cent of its maximum over a full step and by 0.6 per cent over 1/32 of it, in proportion to the step, so the lag is first order and bounded by the two-phase time-step limit. Script: docs/scripts/fig_two_phase_sections.jl.
Scope
The implementation is 2-D, spherical annulus only, and is verified against 1-D solutions (compaction layers and solitary waves) and 2-D conservation properties. A 2-D porosity-wave or melt-channel benchmark is not part of it.
Tests
tests/test_two_phase.jl: off by default and refusals; zero porosity against single-phase Stokes with both solvers, converging at; solver accuracy on weak compaction rows; the extended work-dissipation identity; compaction boundary layers on stretched grids; porosity conservation, positivity and infiltration; the melt_two_phase!ledger; the time loop, checkpoint and resume.benchmarks/two_phase_benchmarks.jl: the full compaction, solitary-wave and conservation series behind the figures (about three hours).
Further reading
Barcilon, V. & Richter, F. M. (1986). Nonlinear waves in compacting media. Journal of Fluid Mechanics 164, 429-448. doi:10.1017/S0022112086002628
Hernlund, J. W. & Tackley, P. J. (2008). Modeling mantle convection in the spherical annulus. PEPI 171, 48-54. doi:10.1016/j.pepi.2008.07.037
Hirth, G. & Kohlstedt, D. L. (2003). Rheology of the upper mantle and the mantle wedge: a view from the experimentalists. In Inside the Subduction Factory, AGU Geophysical Monograph 138, 83-105. doi:10.1029/138GM06
Katz, R. F. (2008). Magma dynamics with the enthalpy method: benchmark solutions and magmatic focusing at mid-ocean ridges. Journal of Petrology 49, 2099-2121. doi:10.1093/petrology/egn058
Keller, T., May, D. A. & Kaus, B. J. P. (2013). Numerical modelling of magma dynamics coupled to tectonic deformation of lithosphere and crust. Geophysical Journal International 195, 1406-1442. doi:10.1093/gji/ggt306
Kohlstedt, D. L. & Holtzman, B. K. (2009). Shearing melt out of the Earth: an experimentalist's perspective on the influence of deformation on melt extraction. Annual Review of Earth and Planetary Sciences 37, 561-593. doi:10.1146/annurev.earth.031208.100104
McKenzie, D. (1984). The generation and compaction of partially molten rock. Journal of Petrology 25, 713-765. doi:10.1093/petrology/25.3.713
Mei, S., Bai, W., Hiraga, T. & Kohlstedt, D. L. (2002). Influence of melt on the creep behavior of olivine-basalt aggregates under hydrous conditions. EPSL 201, 491-507. doi:10.1016/S0012-821X(02)00745-8
Miller, K. J., Zhu, W., Montési, L. G. J. & Gaetani, G. A. (2014). Experimental quantification of permeability of partially molten mantle rock. EPSL 388, 273-282. doi:10.1016/j.epsl.2013.12.003
Shu, C.-W. & Osher, S. (1988). Efficient implementation of essentially non-oscillatory shock-capturing schemes. Journal of Computational Physics 77, 439-471. doi:10.1016/0021-9991(88)90177-5
Simpson, G. & Spiegelman, M. (2011). Solitary wave benchmarks in magma dynamics. Journal of Scientific Computing 49, 268-290. doi:10.1007/s10915-011-9461-y
Simpson, G., Spiegelman, M. & Weinstein, M. I. (2010). A multiscale model of partial melts: 2. Numerical results. JGR Solid Earth 115, B04411. doi:10.1029/2009JB006376
Spiegelman, M. (1993). Flow in deformable porous media. Part 1. Simple analysis. Journal of Fluid Mechanics 247, 17-38. doi:10.1017/S0022112093000369
Stolper, E., Walker, D., Hager, B. H. & Hays, J. F. (1981). Melt segregation from partially molten source regions: the importance of melt density and source region size. JGR 86, 6261-6271. doi:10.1029/JB086iB07p06261
Tian, J., Tackley, P. J. & Lourenço, D. L. (2023). The tectonics and volcanism of Venus: new modes facilitated by realistic crustal rheology and intrusive magmatism. Icarus 399, 115539. doi:10.1016/j.icarus.2023.115539
Wark, D. A. & Watson, E. B. (1998). Grain-scale permeabilities of texturally equilibrated, monomineralic rocks. EPSL 164, 591-605. doi:10.1016/S0012-821X(98)00252-0