A stiff lower mantle and the planform of convection (2-D)
Seismic tomography shows the Earth's mantle dominated by structure of very long wavelength: two large low-velocity regions under Africa and the Pacific, and a ring of fast, cold material beneath the subduction zones around them. Bunge, Richards & Baumgardner (1996) asked whether that pattern needs plates, or whether the viscosity structure of the mantle alone can produce it. They ran the same 3-D spherical shell with a viscosity that depends only on depth, once uniform and once with the lower mantle 30 times stiffer than the upper mantle, and found that the stiff lower mantle shifts the flow to much longer wavelengths. This example repeats their four cases in the spherical annulus.
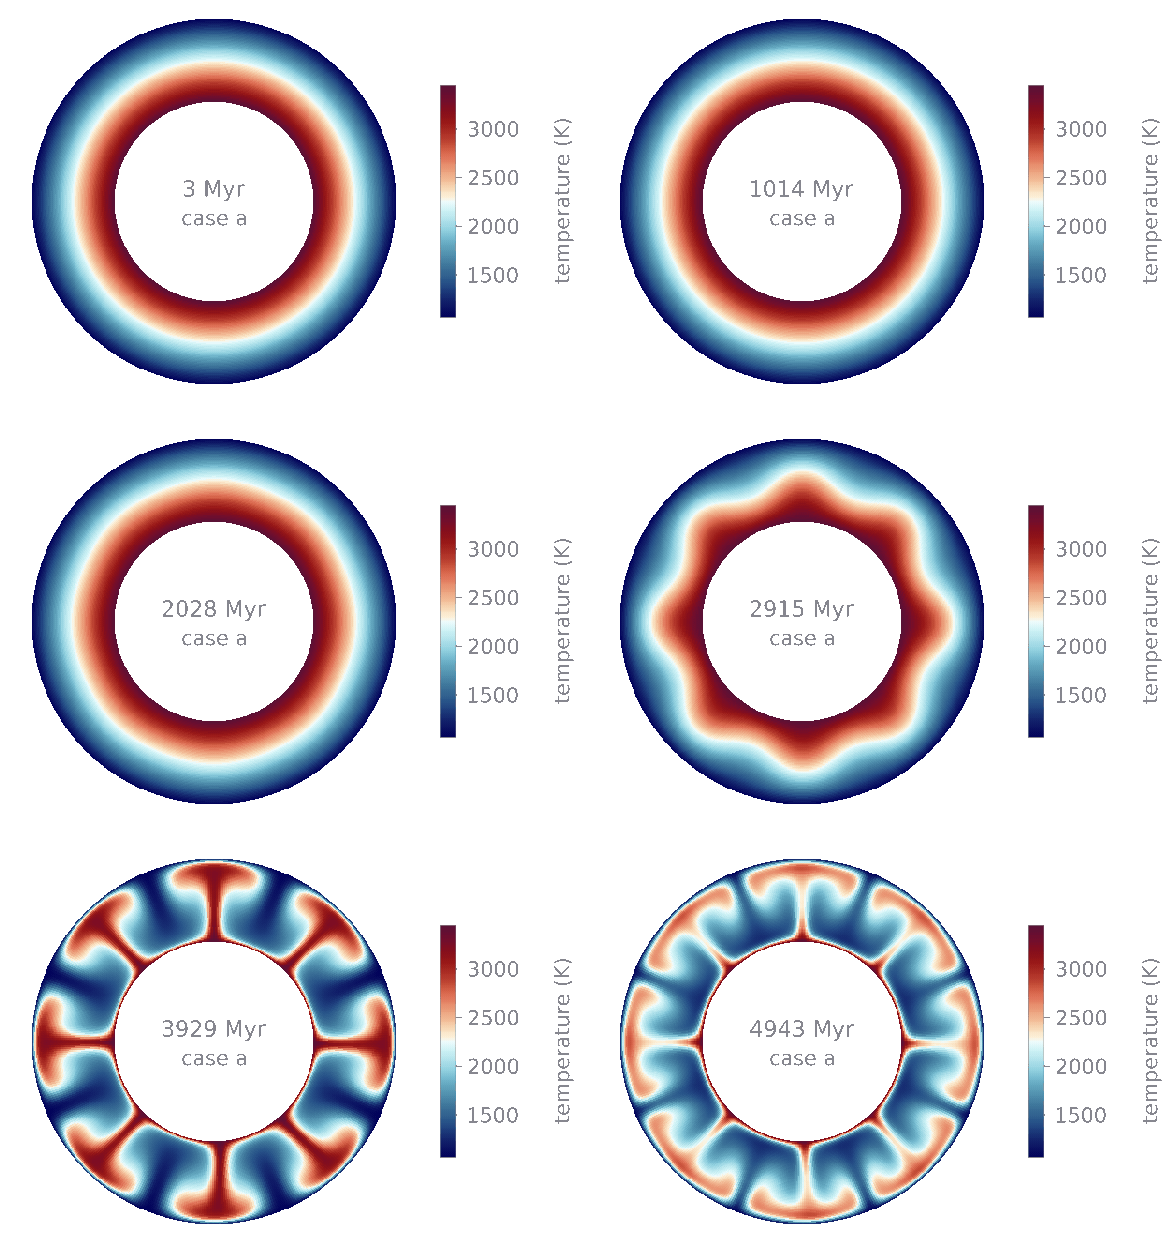
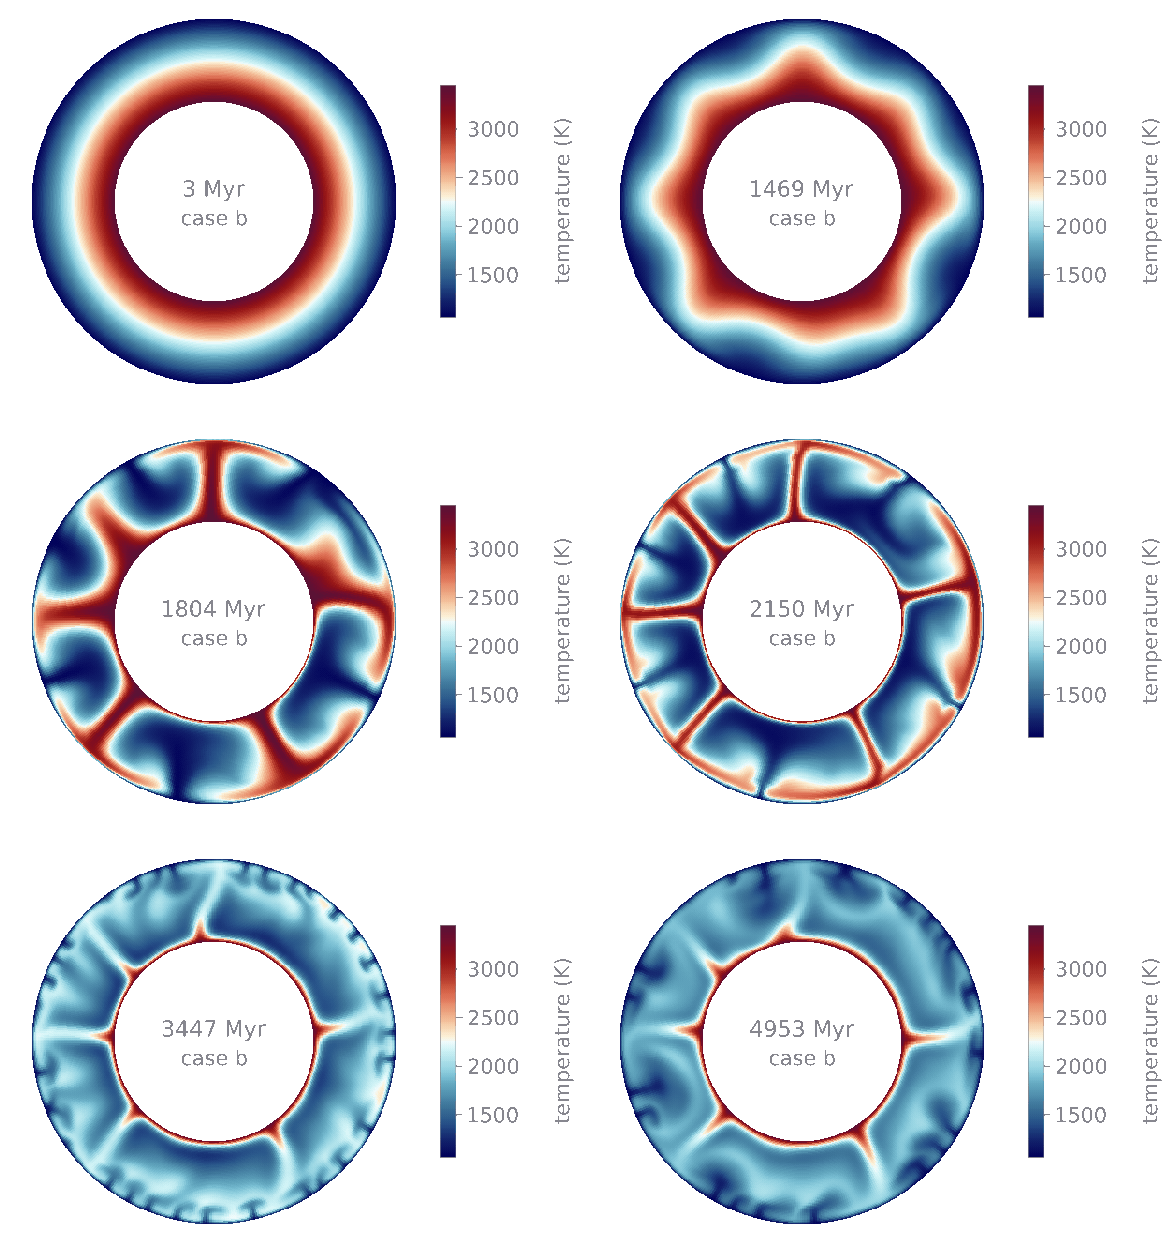
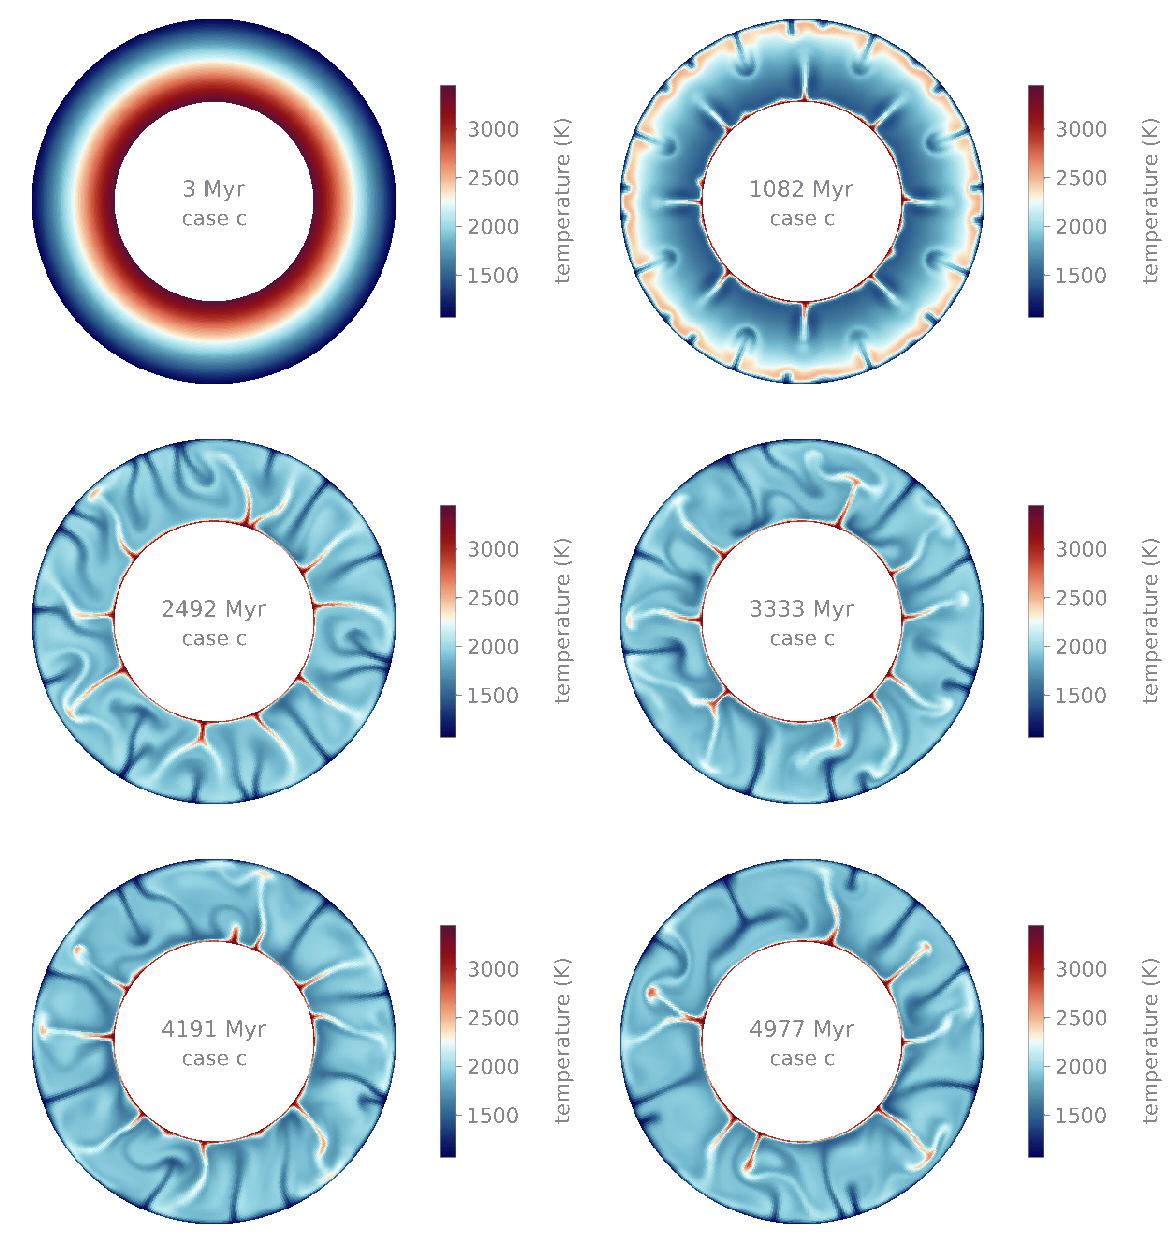
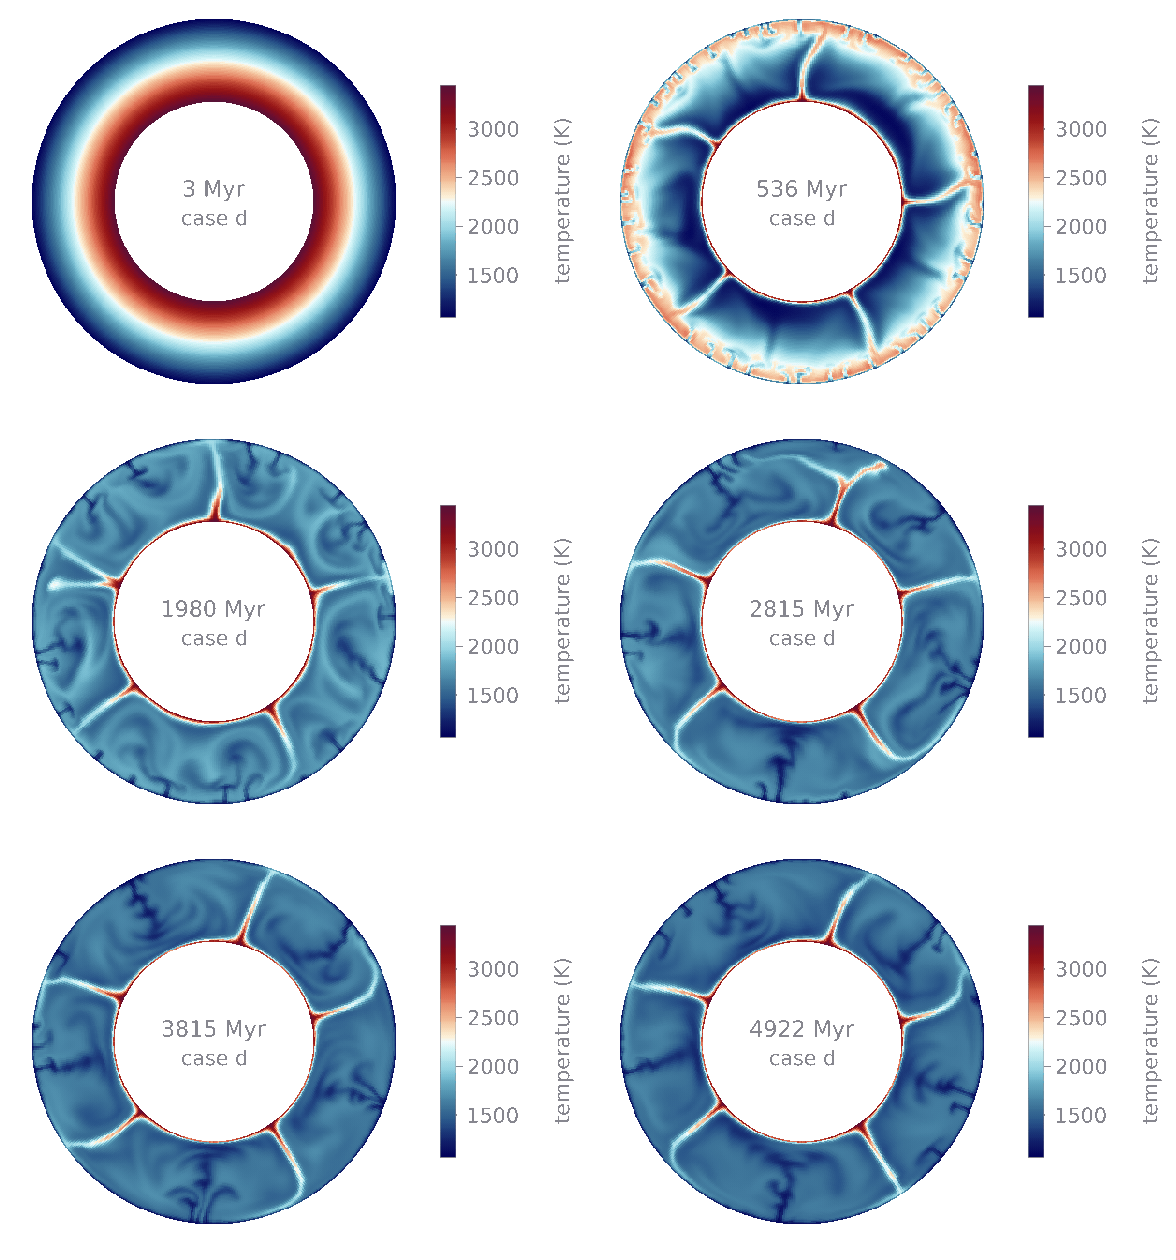
Temperature (1060 to 3450 K) of the four cases over 5 Gyr, Nr = 64 (64 × 512 cells).
Set-up
| shell | |
| walls | 1060 K at the surface, 3450 K at the core-mantle boundary |
| material | Boussinesq, |
| heating | internal, |
| viscosity | depends on depth only, one value above and one below 670 km |
| initial state | conductive profile with a degree-8 perturbation of 20 K and 5 K noise |
| run | 5 Gyr |
The four viscosity profiles are those of Bunge et al. (1996). Cases a and b have nearly the same lower mantle (
Planform
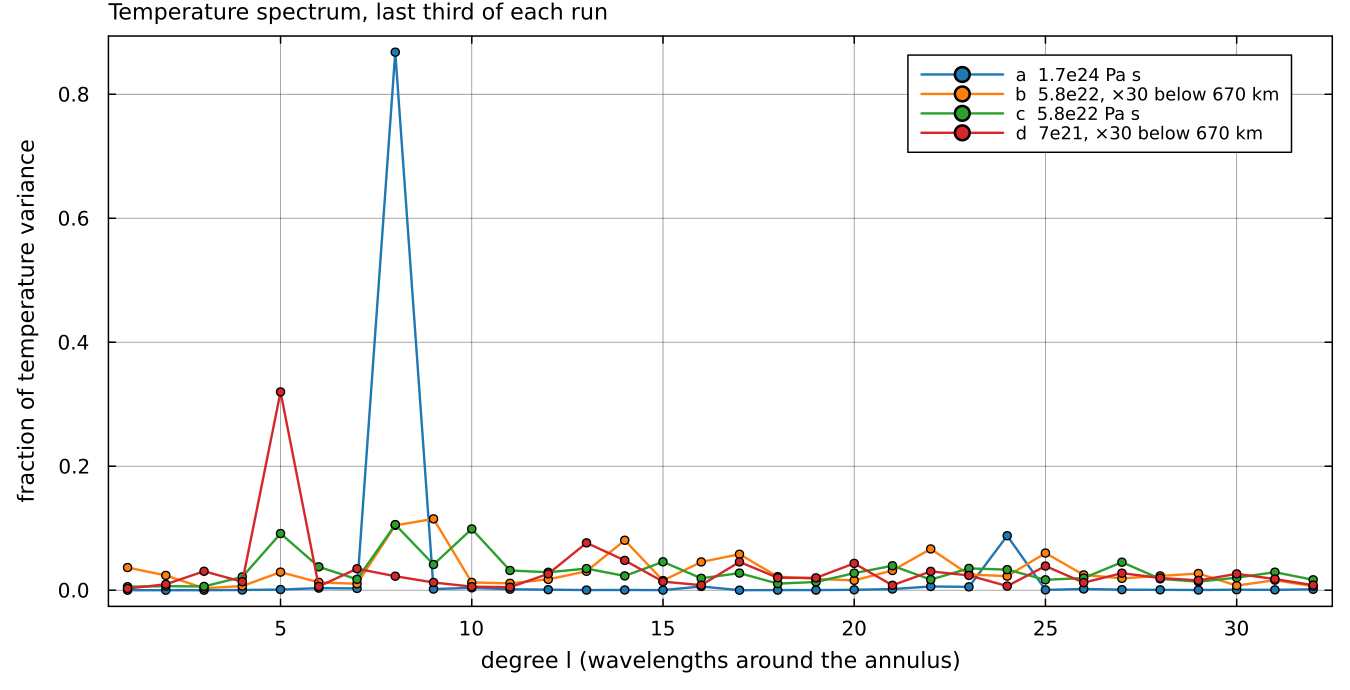
Power of the azimuthal Fourier modes of the depth-averaged temperature anomaly of each column, over the last third of each run, normalised to unit total. Degree docs/scripts/fig_bunge.jl.
Thin plumes and sheets spread power over many degrees, so the script also counts the up- and downwellings directly, on the node ring at mid-depth, as the stretches where the radial velocity is above a quarter of its largest value (upwellings) or below minus a quarter of it (downwellings).
| case | Ra | upwellings | downwellings | peak degree | ||
|---|---|---|---|---|---|---|
| a | 8.0 | 8.0 | 8 | 0.15 | 2060 | |
| b | 6.1 | 7.5 | 9 | 0.09 | 1805 | |
| c | 7.2 | 8.0 | 8 | 0.58 | 1874 | |
| d | 5.0 | 5.0 | 5 | 0.70 | 1593 |
Counts and spectrum: averages over the last third of each run's frames. diagnostics.csv.
Case a is barely convecting. At
Case c, with the same viscosity everywhere and thirty times the Rayleigh number, forgets its start. Hot plumes rise from the core-mantle boundary and cold sheets fall from the surface, about seven to eight of each, and they come and go; the interior is stirred by smaller eddies between them.
Case b differs from c only in the 30-fold jump at 670 km. The jump slows everything (the rms velocity drops from 0.58 to 0.09 cm yr⁻¹, since most of the mantle is now thirty times stiffer) and thins the count of upwellings from about seven to six. The plumes are more regularly spaced and longer lived than in case c, while small cold drips keep forming in the upper mantle between them.
Case d is the stiff-lower-mantle case at a higher convective vigour. It settles into five long-lived plumes, evenly spaced, and five broad downwellings between them; the spectrum is dominated by degree 5. The upper mantle between the plumes is cut by many small cold drips that never reach the lower mantle. This is the behaviour Bunge et al. (1996) described: the stiff lower mantle filters out short wavelengths and the large-scale flow is carried by a few long-lived upwellings, while the upper mantle keeps its small-scale convection.
The annulus is a two-dimensional cut through a sphere, so the numbers of plumes are not the spherical-harmonic degrees of the 3-D calculation, and one run per case does not average over the chaotic variability of b, c and d. The comparison between the cases is the result, not the absolute counts.
Running it
for c in a b c d; do
  MILEVA_OUTDIR=output/bunge_$c MILEVA_VTKEVERY=40 julia --project=. -t 2 \
      examples/annulus_bunge_2d.jl $c 64
done
julia --project=. docs/scripts/fig_bunge.jl output
Arguments are the case and Nr. The runs took 8, 13, 37 and 92 minutes on 2 threads; the time step falls as the convection becomes faster.
References
Bunge, H.-P., Richards, M. A. & Baumgardner, J. R. (1996), Effect of depth-dependent viscosity on the planform of mantle convection, Nature 379, 436-438, doi:10.1038/379436a0.