Mantle convection with continents (2-D)
Continents are thick, light and stiff. They float on the mantle, they insulate it, and they guide where plates break and where slabs sink. van der Wiel, van Hinsbergen, Thieulot & Spakman (2024) built a 2-D annulus model of the whole mantle with three continental rafts and three subducting slabs, a layered visco-plastic rheology and the 410 and 660 km phase transitions, and followed it for 1 Gyr. This example sets up their model R from the authors' published input files and runs it in the spherical annulus.
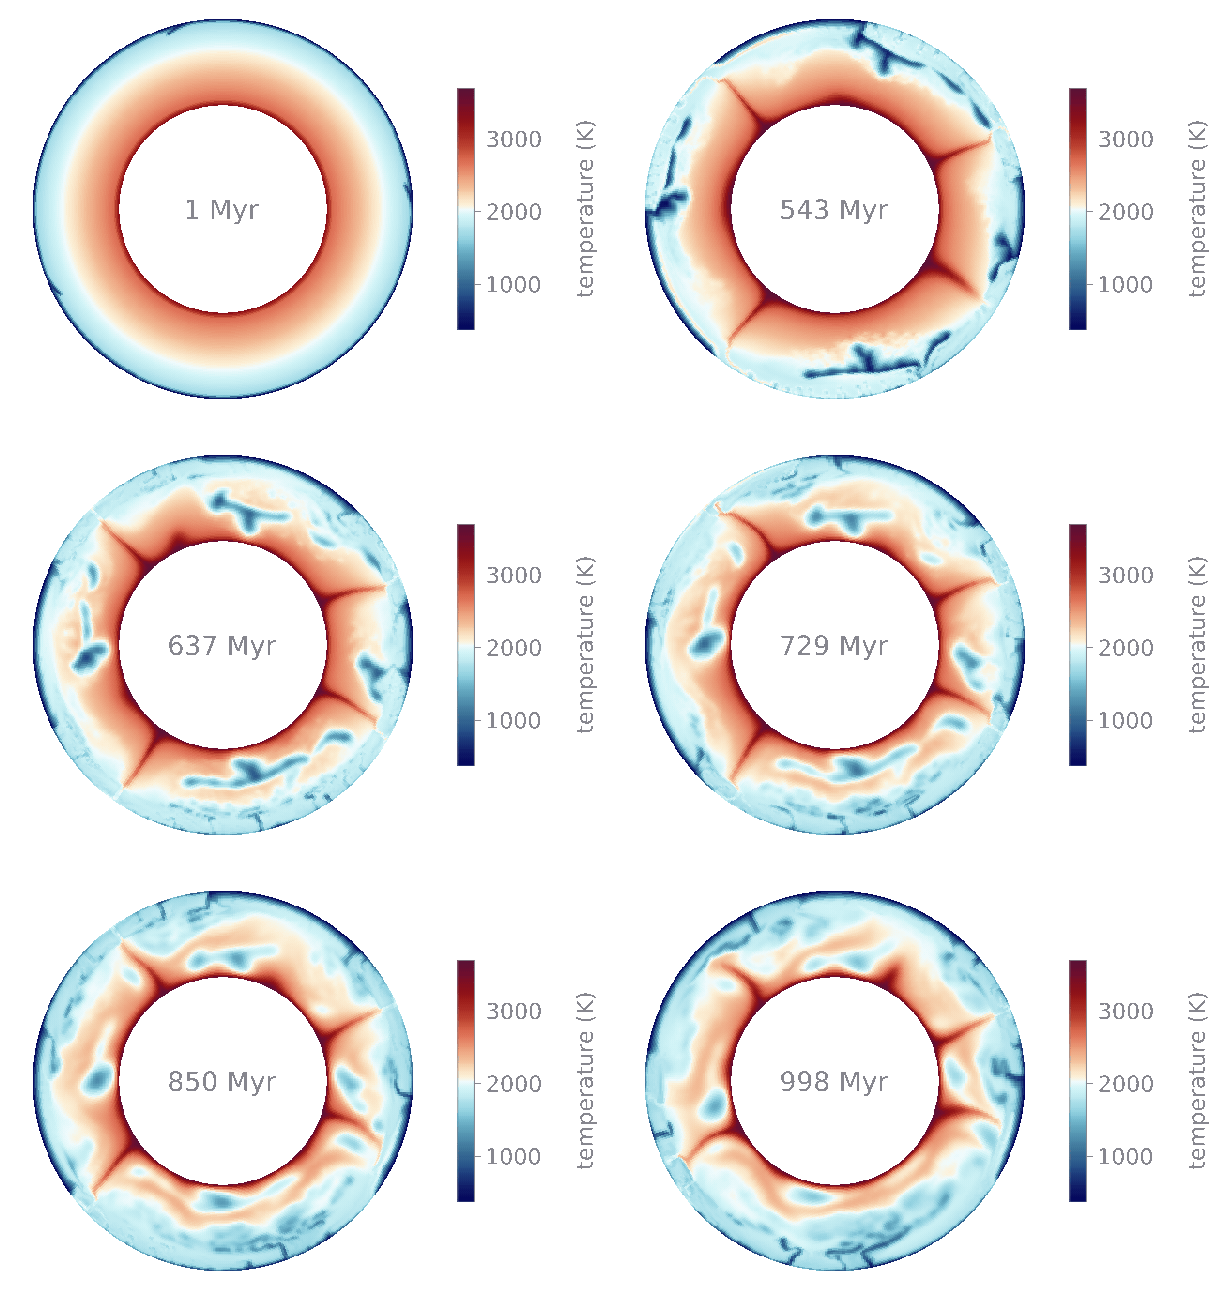
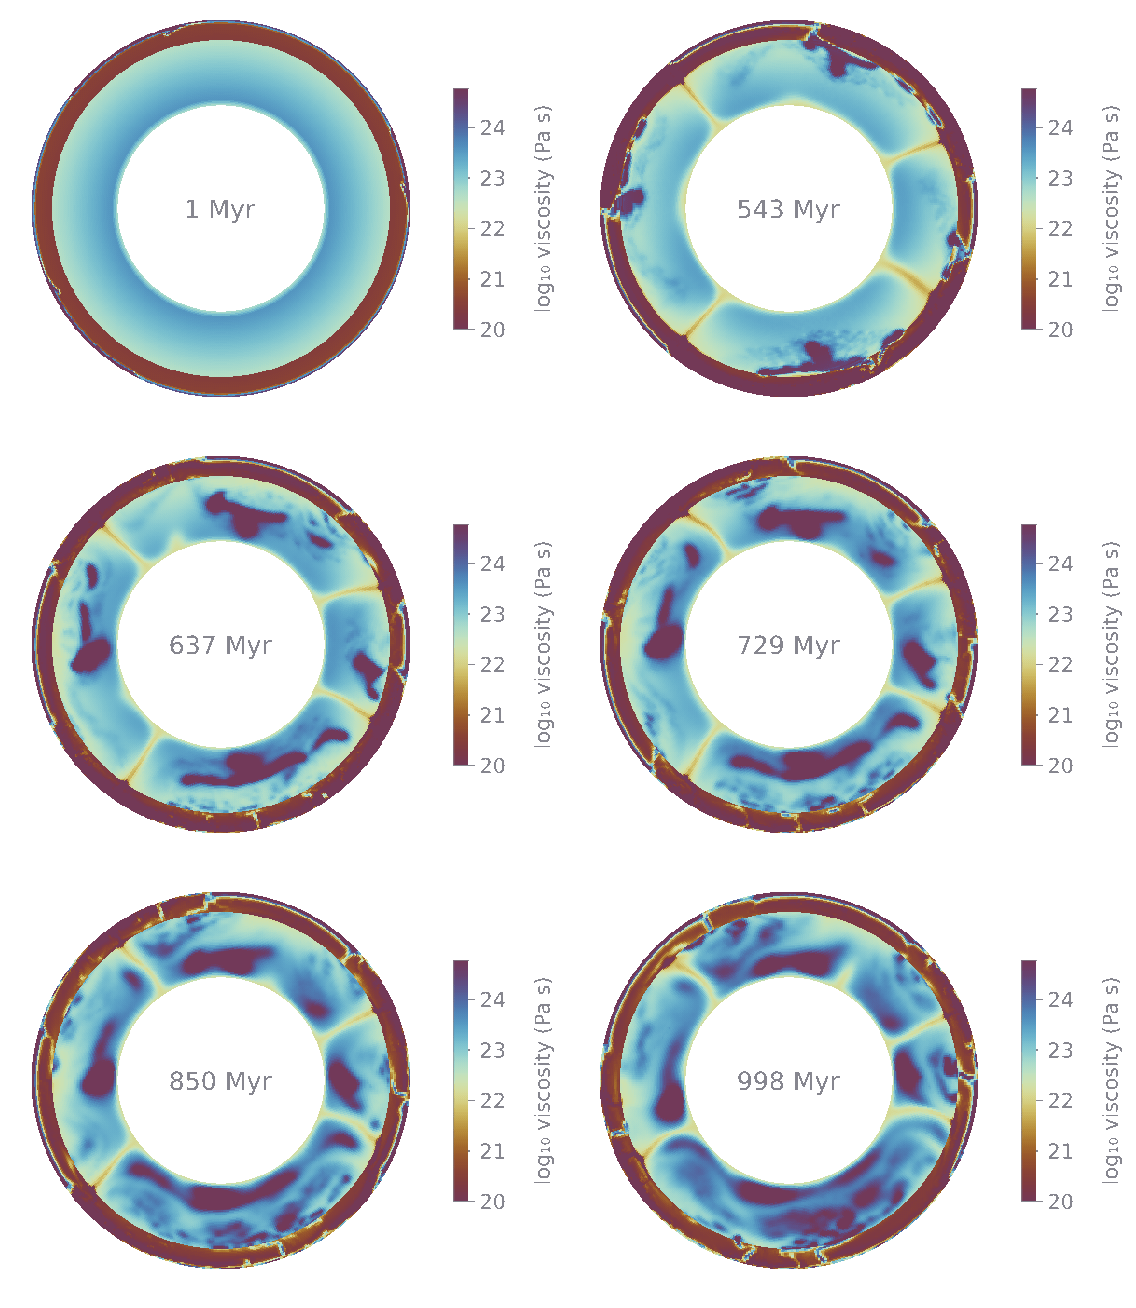
Temperature and viscosity over 1 Gyr, Nr = 64 (64 × 512 cells).
Set-up
| shell | |
| walls | 300 K at the surface, 3700 K at the core-mantle boundary |
| reference state | anelastic liquid, Perple_X pyrolite table, adiabat from 1600 K |
| heating | internal |
| phase changes | 410 km (+3 MPa K⁻¹, +273 kg m⁻³) and 660 km (−2.5 MPa K⁻¹, +341 kg m⁻³) |
| continents | three rafts 150 km thick over 0 to 27°, 100 to 145° and 200 to 245°, 400 kg m⁻³ lighter than the mantle, at the viscosity cap |
| slabs | trenches at −6°, 94° and 194°, each dipping under the raft beside it |
| run | 1 Gyr |
The viscosity of the mantle combines diffusion and dislocation creep harmonically, each of the form
with separate parameters above and below 660 km and bounds of
with
Stagnant start, break-up and plate-like convection


Temperature (top) and log₁₀ viscosity (bottom) at 0, 0.3, 0.49, 0.52, 0.7 and 1 Gyr.
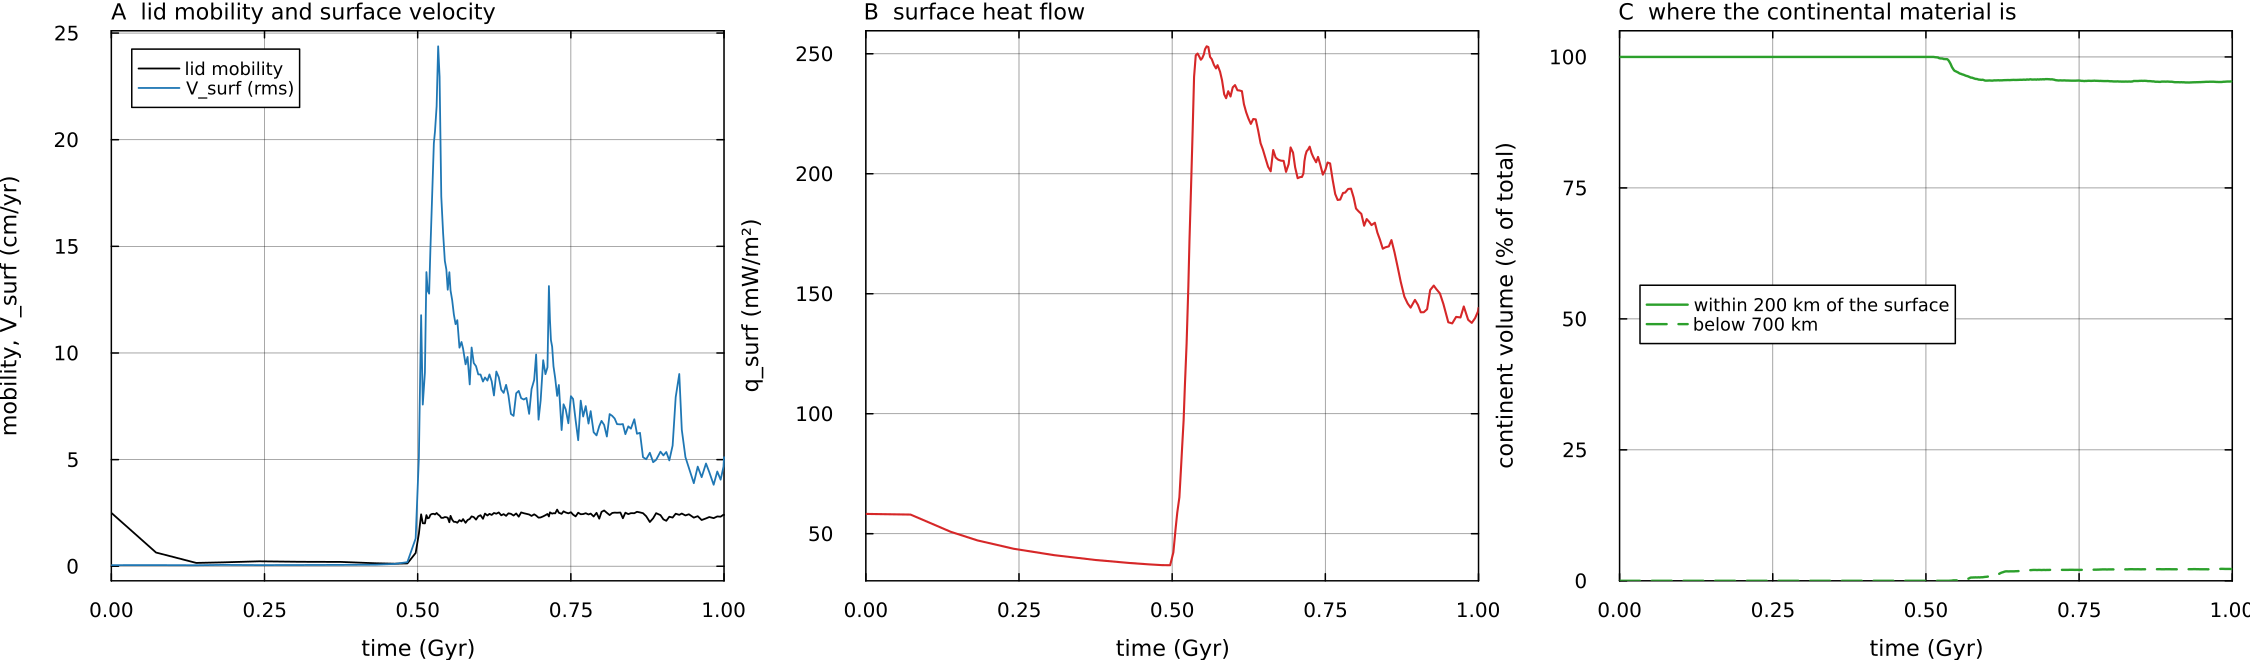
A: lid mobility (rms surface velocity over rms velocity of the whole mantle) and rms surface velocity. B: surface heat flow. C: fraction of the continental volume within 200 km of the surface and below 700 km. Computed by docs/scripts/fig_continents.jl from diagnostics.csv and the 343 VTK frames.
Stagnant lid, 0 to 0.49 Gyr. The initial slabs are cold enough to sit at the viscosity cap and do not sink, so the lid starts locked: the mobility falls to 0.2 and the surface moves at 0.06 cm yr⁻¹. The mantle warms slowly under it (2064 to 2080 K) and the surface heat flow decays from 58 to 37 mW m⁻². Hot plumes grow from the core-mantle boundary.
Break-up, 0.49 to 0.55 Gyr. When the plumes reach the base of the lid it yields. The mobility jumps to 2.4, the surface velocity peaks at 24 cm yr⁻¹ and the surface heat flow rises to 250 mW m⁻² as the warm interior is brought to the surface.
Plate-like convection, 0.55 to 1 Gyr. The lid stays mobile, with a mobility between 2 and 2.6. New slabs form at the plate boundaries and sink through the transition zone; their cold, stiff remnants pile up in the lower mantle as the high-viscosity patches of the 0.7 and 1 Gyr frames. The mantle cools from 2090 to 1940 K, and the surface velocity and heat flow decay together, to about 5 cm yr⁻¹ and 140 mW m⁻² at 1 Gyr.
The continents stay at the surface. They ride on the moving plates and are deformed at their edges, but at 1 Gyr 95 % of their volume is still within 200 km of the surface. About 2 % has been dragged into the lower mantle with the slabs.
Comparison with the paper
| lid mobility | rms surface velocity (cm yr⁻¹) | |
|---|---|---|
| this run, 0 to 1 Gyr | 1.32 | 4.1 |
| this run, 0.5 to 1 Gyr (mobile phase) | 2.36 | 8.0 |
| van der Wiel et al. (2024), model R | 2.218 | 2.1 |
Time-weighted means of the rows of diagnostics.csv.
Once the lid is mobile, its mobility is close to the paper's value, 2.36 against 2.218. The plates move about four times faster than in the paper, though, and the first half billion years are a stagnant lid, which pulls the 1 Gyr average mobility below the paper's value.
The set-up differs from the paper's in ways that bear on both:
the paper's annulus is a cross-section through a cylinder, whose core-mantle boundary has 0.546 of the surface's area against 0.298 in the spherical annulus, so heat from the core weighs more there;
the paper's mesh refines adaptively, while here the radial cells are a uniform 45 km;
here the 410 to 660 km layer uses the upper-mantle creep laws, and the rheology switches at fixed depths, not along the deflected phase boundaries;
the reference state is a Perple_X pyrolite table, not the paper's isentropic compression with latent heat.
The driver header lists these in full.
Running it
MILEVA_OUTDIR=output/continents MILEVA_MAXTIME_MYR=1000 MILEVA_VTKEVERY=40 \
    julia --project=. -t 2 examples/annulus_continents_2d.jl 64
julia --project=. docs/scripts/fig_continents.jl output/continents
The argument is Nr. The run took 9.4 hours on 2 threads (13 716 steps). The mean time step is about 13 times shorter once the lid breaks.
References
van der Wiel, E., van Hinsbergen, D. J. J., Thieulot, C. & Spakman, W. (2024), Linking rates of slab sinking to long-term lower mantle flow and mixing, Earth Planet. Sci. Lett. 625, 118471, doi:10.1016/j.epsl.2023.118471.