Phase changes
MILEVA describes the solid-state transitions of the olivine system (the 410, 520 and 660 km transitions and post-perovskite), the basalt-to-eclogite transition, and the latent heat of these transitions and of melting. None of them is a marker state. Each is evaluated on the grid every step from the lithostatic pressure and the local temperature:
| what | where it acts | function |
|---|---|---|
integer phase index phase_id | gate for the smooth phase buoyancy; latent-heat counter when the smooth latent heat is off | melt_phase (physics/melt_phase.jl) |
| smooth phase functions | density in the momentum equation | compute_buoyancy (physics/compute_buoyancy.jl) |
| smooth phase fractions and their material derivative | latent heat in the energy equation | melt_phase |
| eclogite fraction | density of basalt below the transition depth | compute_buoyancy |
The pressure throughout is the lithostatic mantle_pressure(z, cfg) (physics/melt_phase.jl), the hydrostat of the reference density of the selected compressibility mode (
Physical background
What a solid-state phase transition is
Mantle rock is a mixture of minerals, and each mineral is stable only over a limited range of pressure and temperature. When a parcel is carried deep enough, its atoms rearrange into a more compact crystal structure of the same chemical composition. This is a solid-state phase transition. Nothing melts, but the density jumps, heat is taken up or released, and the elastic and seismic properties change. The seismic discontinuities of Earth's mantle near 410 and 660 km depth are the clearest evidence for such transitions. Their depths, widths and density jumps fit transitions in the olivine component of a peridotite mantle (Ringwood 1991; Bina & Helffrich 1994). The Preliminary Reference Earth Model puts density jumps of about 180 kg m
| Earth depth | reaction | Clapeyron slope | role |
|---|---|---|---|
| about 410 km | olivine to wadsleyite | positive (exothermic) | helps flow across it |
| about 520 km | wadsleyite to ringwoodite | positive, small density jump | weak effect |
| about 660 km | ringwoodite to bridgmanite plus ferropericlase | negative (endothermic) | resists flow across it |
| a few hundred km above the core | bridgmanite to post-perovskite | large, positive (Hirose 2006) | modifies the lowermost mantle |
For Mg
- and is thought to be stable in the D″ layer at the base of Earth's mantle
(Hirose 2006).
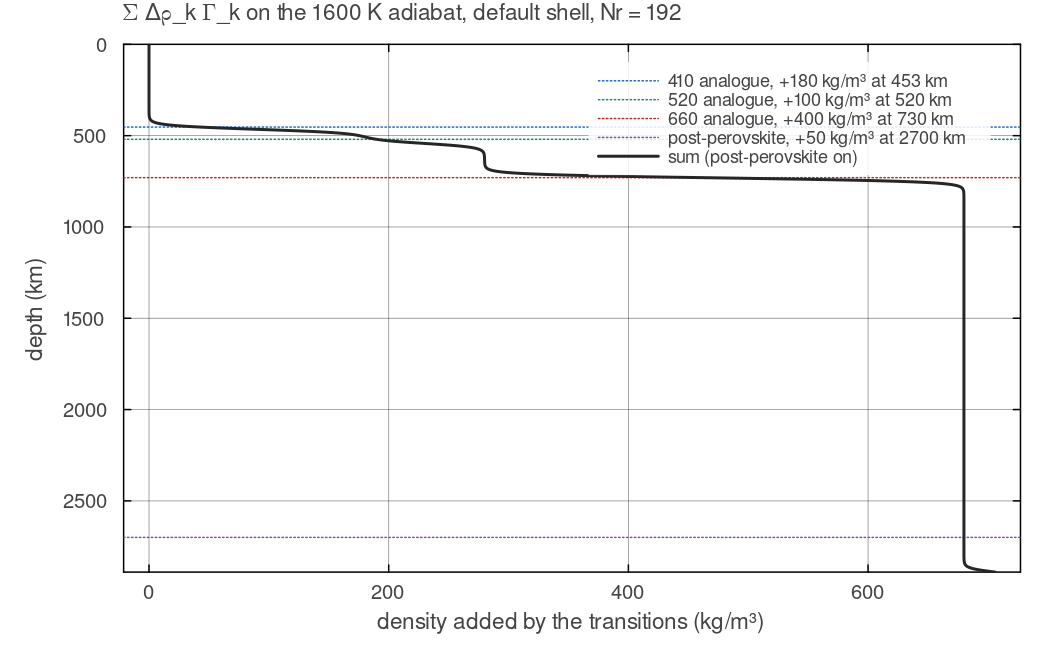
The density added by the solid-state transitions along the code's 1600 K adiabat, phase_transitions and phase_fraction with the mesh-derived width of a 192-cell default shell and post-perovskite switched on. The steps of 180, 100, 400 and 50 kg/m³ sum to 730 kg/m³. The 410 km analogue sits slightly below its nominal 453 km because the adiabat there is hotter than its 1600 K pivot. In the buoyancy only the lateral departures from these steps act. Script: docs/scripts/fig_phase_changes_sections.jl.
Venus
The transitions are set by pressure, not by depth. A body with the mineralogy of Earth's mantle but a different gravity has the same transitions at different depths. Venus has a surface gravity of 8.87 m scfg.usePostPerovskite = false).
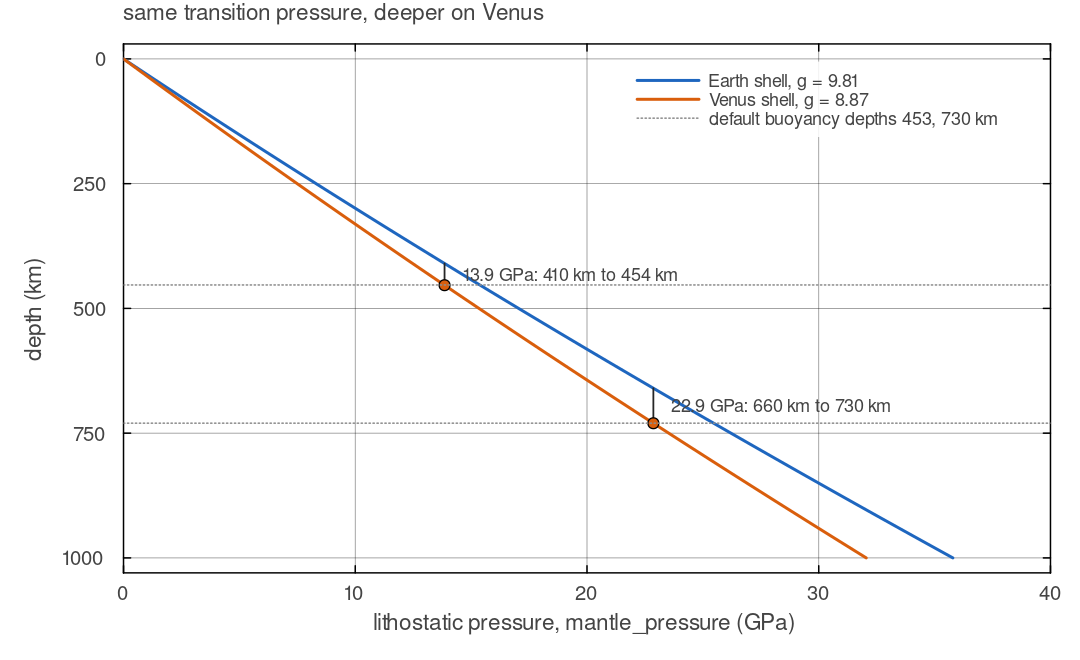
mantle_pressure for the default Earth shell (g = 9.81 m/s²) and a Venus shell (R_out = 6052 km, R_in = 3110 km, g = 8.87 m/s²), both under the default ALA reference state. The pressure of 13.9 GPa found at 410 km on Earth is reached at 454 km on Venus, and 22.9 GPa from 660 km at 730 km, which are the default transition depths of 453 and 730 km. Script: docs/scripts/fig_phase_changes_sections.jl.
The Clapeyron slope and boundary topography
Along a phase boundary the two phases have equal Gibbs free energy. Differentiating that equality gives the Clausius-Clapeyron relation,
where
The slope decides how the boundary responds to a temperature anomaly. Inside a cold downwelling a boundary with
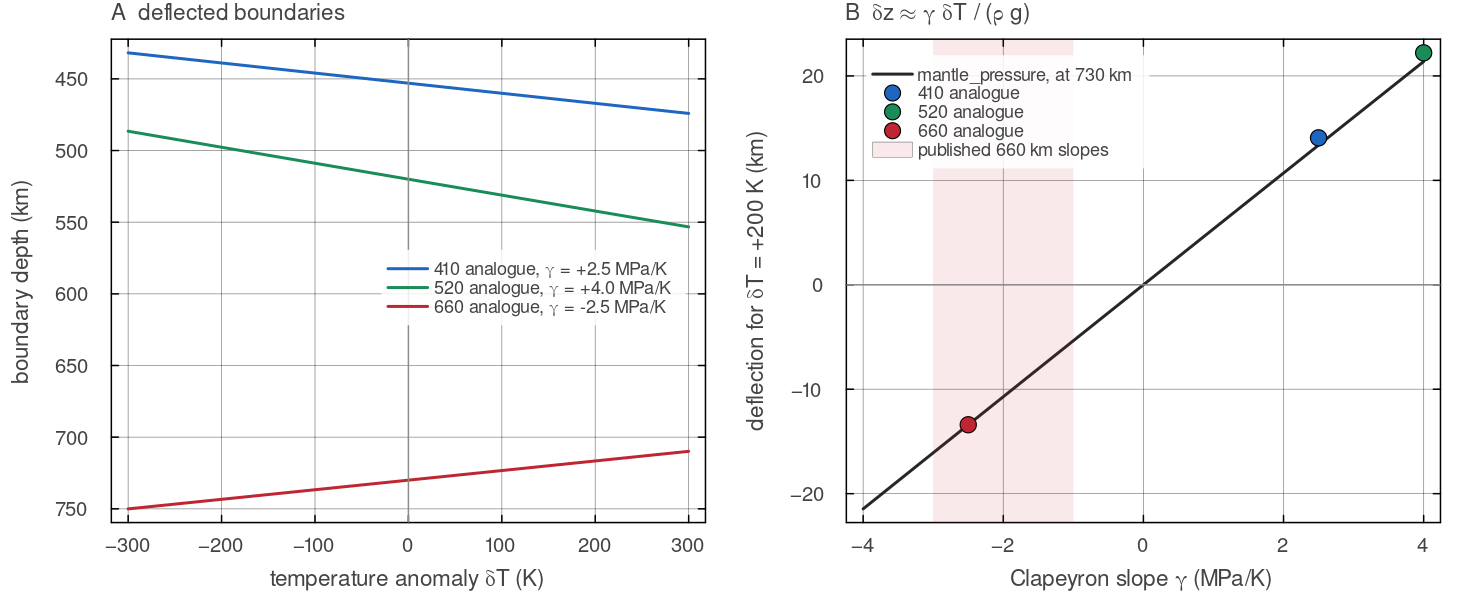
(A) Depth of each boundary against the temperature anomaly from its pivot, found by inverting mantle_pressure for docs/scripts/fig_phase_changes_sections.jl.
How a phase boundary pushes on the flow
A boundary that is flat everywhere adds the same density at every point of a given radius. That changes the hydrostatic pressure but cannot drive flow, which responds only to lateral density differences (see Buoyancy and composition). A deflected boundary is different. In a cold slab sinking through the 410 km transition, the boundary has risen, so a slice of the slab is already in the dense phase where its surroundings are not. That extra mass pulls the slab down and adds to its negative thermal buoyancy. At 660 km the boundary inside the slab is pushed down, so the slab stays in the light phase while its surroundings at the same depth have already transformed. The slab is then buoyant relative to them and is held back. A hot plume rising from below is resisted in the same way. Inside it the 660 km boundary is raised, so the plume stays in the dense phase over a depth range where its surroundings are already in the light one. The endothermic transition is therefore a partial barrier to vertical flow, and the exothermic ones are accelerators.
The strength of the barrier is measured by the phase buoyancy parameter of Christensen & Yuen (1985). Compare the extra mass per unit area from the deflected boundary,
The phase buoyancy parameter
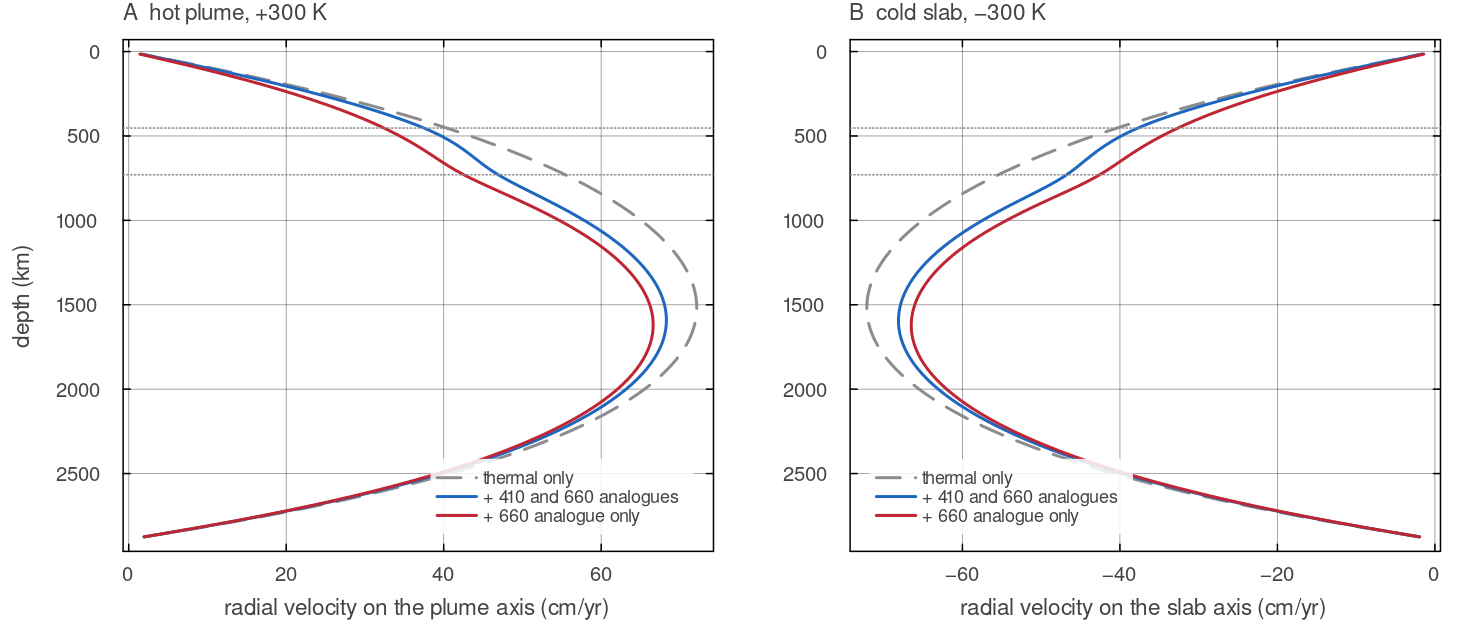
Radial velocity on the axis of a column 300 K hotter (A) and one 300 K colder (B) than the 1600 K adiabat, from one direct solve of assemble_stokes with the body force of compute_buoyancy and a uniform docs/scripts/fig_phase_changes_sections.jl.
Latent heat
The same entropy change that sets the Clapeyron slope releases or absorbs heat as material crosses the boundary. A parcel that transforms completely changes temperature by roughly
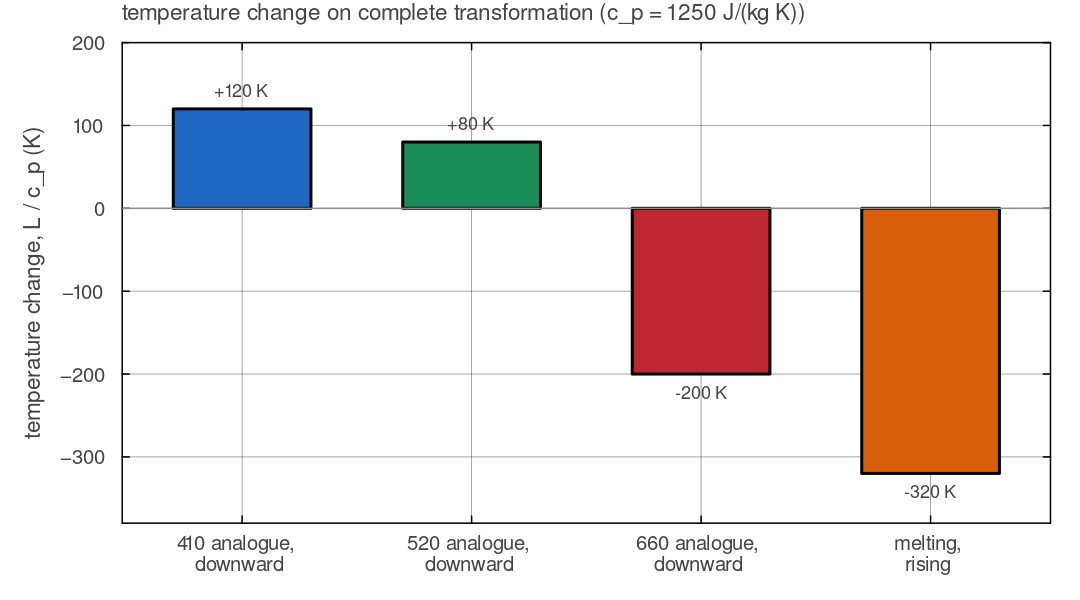
CP_REF = 1250 J/(kg K). The transition values are measured from melt_phase by integrating its latent-heat rate over a column sinking through each boundary at 1 cm/yr, which recovers the 150, 100 and −250 kJ/kg fixed in the function. That is +120 K and +80 K of warming at the exothermic 410 and 520 km analogues, 200 K of cooling at the endothermic 660 km analogue. The melting bar is cfg.latentHeatMelt = 400 kJ/kg, 320 K of cooling for complete melting on the way up. Script: docs/scripts/fig_phase_changes_sections.jl.
Basalt to eclogite
Basaltic crust is not stable at depth either. With increasing pressure, plagioclase breaks down and garnet grows, and basalt or gabbro transforms through garnet granulite into eclogite, a garnet and clinopyroxene rock that is denser than the basalt it formed from and, through most of the upper mantle, denser than the surrounding peridotite (Ringwood & Green 1966). This is what lets oceanic crust sink with a subducting slab on Earth, and it is a candidate trigger for the delamination of thick crust on Venus, where there is no subduction to remove it. The reaction is slow in cold, dry rock, so basalt can survive metastably well below its equilibrium depth and eclogite can survive above it (Ahrens & Schubert 1975). MILEVA treats this transition as a function of depth by default and offers the second kind of metastability as an option, below.
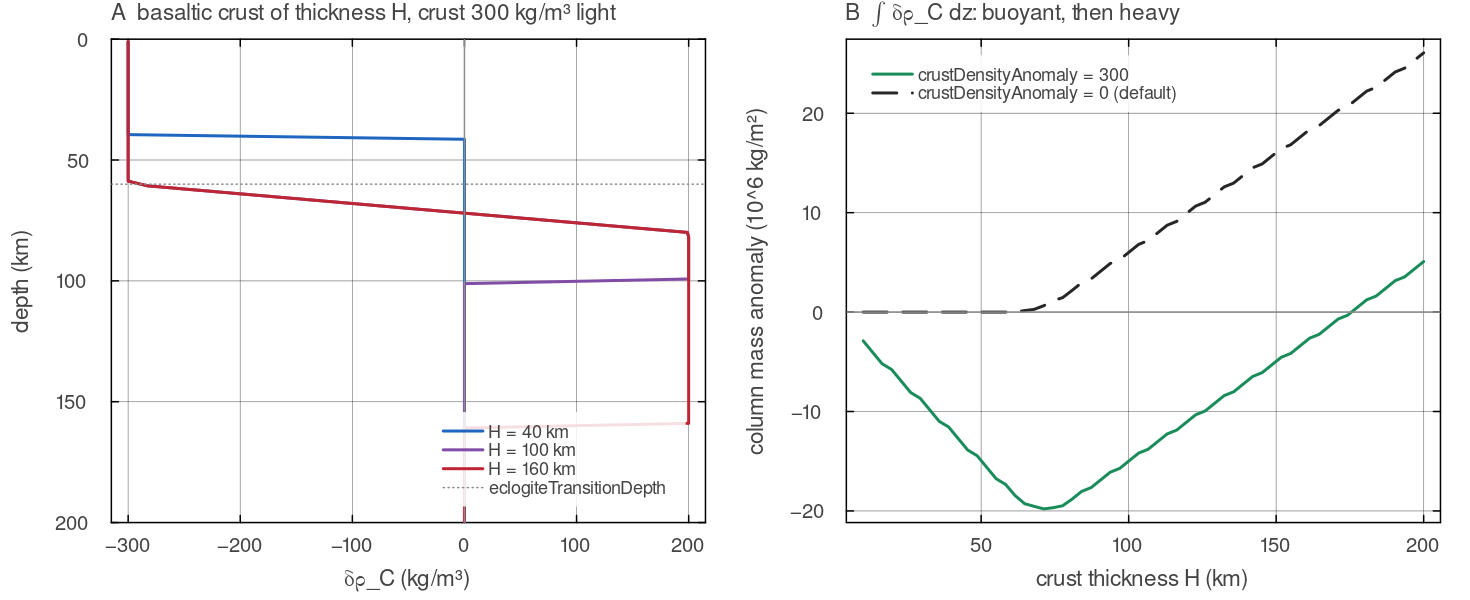
Why a thickening crust can founder. (A) compute_buoyancy for a basaltic crust 40, 100 and 160 km thick, with an illustrative crust contrast cfg.crustDensityAnomaly = 300 kg/m³ (the default is zero). Basalt above the eclogite ramp is light and below it heavy. (B) The mass anomaly of the whole column, docs/scripts/fig_phase_changes_sections.jl.
Olivine-system transitions
A phase transition is evaluated in a fixed sequence of small steps. The code first finds the pressure at each cell from its depth, then moves the transition pressure up or down with the local temperature (the Clapeyron slope), and turns the distance from that boundary into a smooth fraction
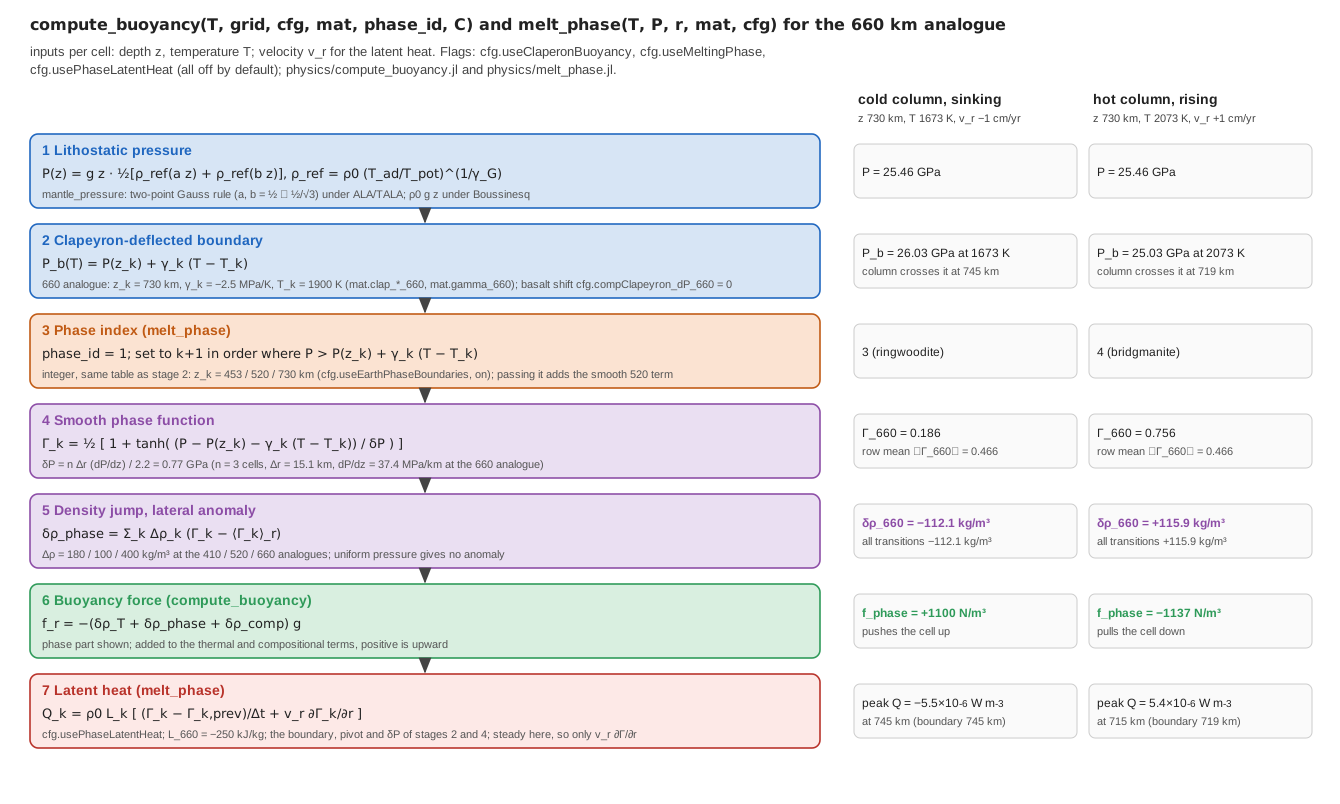
The 660 km analogue for one cell row, stage by stage, on the default shell with Nr = 192, a 1600 K potential temperature and the flags cfg.useClaperonBuoyancy, cfg.useMeltingPhase and cfg.usePhaseLatentHeat switched on. Right: the values for a cell at 730 km in a column 200 K colder than the adiabat sinking at 1 cm/yr (1673 K), and in a column 200 K hotter rising at 1 cm/yr (2073 K). The cold cell lies above its deflected boundary (745 km), is lighter than the row mean by 112 kg mcompute_buoyancy and melt_phase return for those cells. Script: docs/scripts/fig_phase_changes_pipeline.jl.
Phase boundaries
A transition
A positive slope (exothermic, 410 and 520 km) puts the boundary deeper in hot material and shallower in cold material; a negative slope (endothermic, 660 km) does the opposite. For a lateral anomaly
about 15 km for
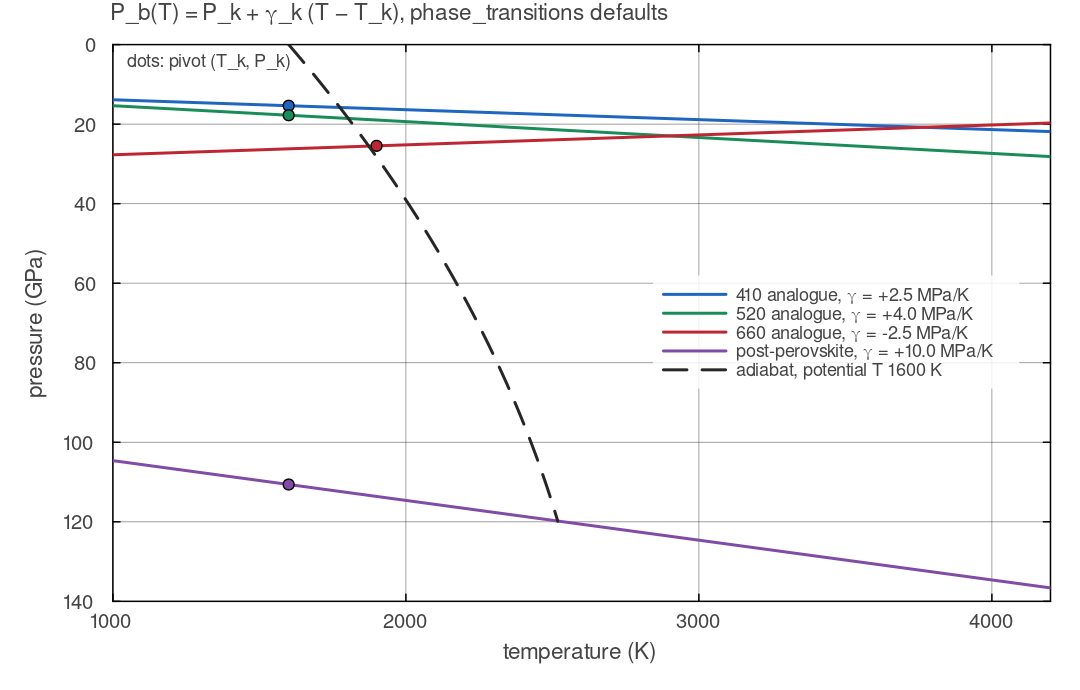
phase_transitions with post-perovskite on, each line passing through its pivot mantle_pressuredocs/scripts/fig_phase_changes_sections.jl.
Phase index
When cfg.useMeltingPhase = true, melt_phase assigns every cell an integer phase (1 olivine, 2 wadsleyite, 3 ringwoodite, 4 bridgmanite, 5 post-perovskite) by testing phase_transitions, from mat and, for post-perovskite, cfg), so the phase index, the phase buoyancy and the phase latent heat sit on one boundary:
| transition | |||
|---|---|---|---|
| olivine to wadsleyite | 453 km | 1600 K | |
| wadsleyite to ringwoodite | 520 km | 1600 K | |
| ringwoodite to bridgmanite | 730 km | 1900 K | |
| bridgmanite to post-perovskite | cfg.ppvDepth_km (2700 km) | cfg.ppvClapeyron ( | 1600 K |
cfg.useEarthPhaseBoundaries = false leaves every cell in phase 1 (for a body with a different mineralogy), and post-perovskite is assigned only with cfg.usePostPerovskite = true. The phase index does not enter the density: a step function of the cell index would put a whole density jump into a single cell. Its role is to switch on the smooth 520 km and post-perovskite terms below (they are added only when a phase field is passed to compute_buoyancy), and to drive the integer latent-heat counter when the smooth latent heat is off.
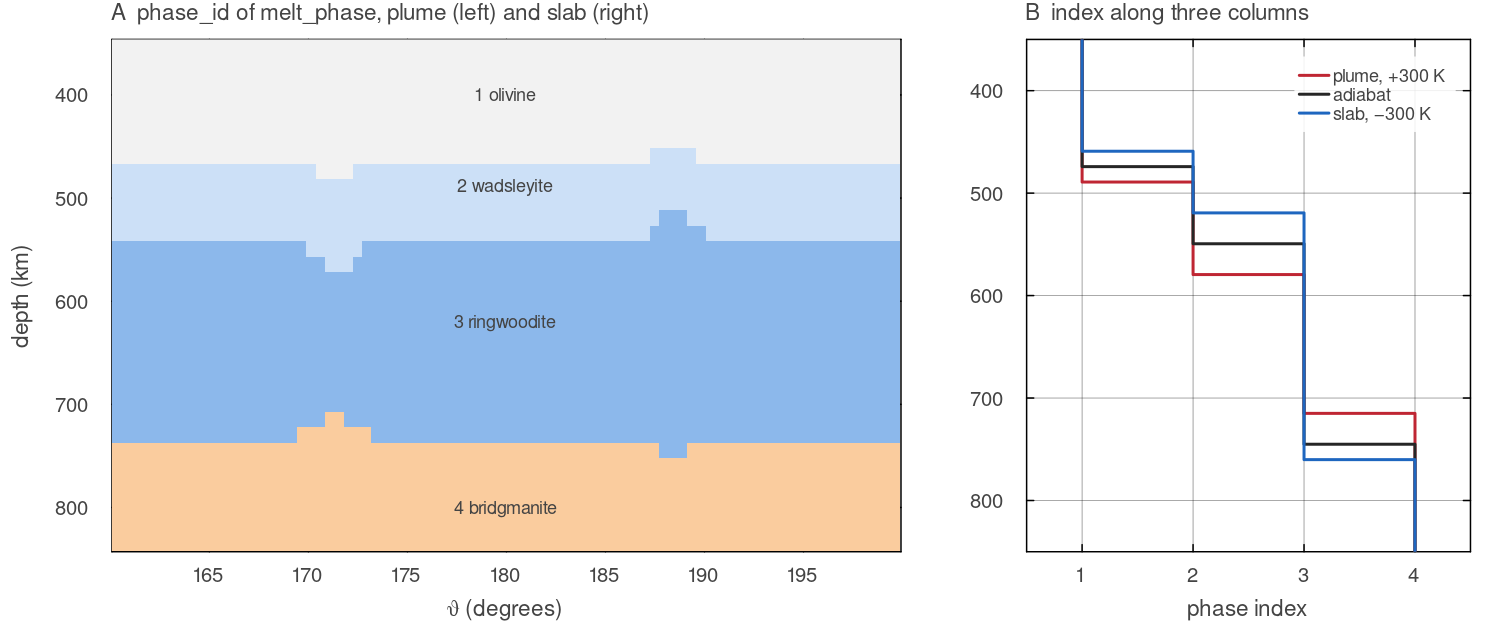
(A) phase_id returned by melt_phase for a section with a column 300 K hotter (left) and one 300 K colder (right) than the 1600 K adiabat, on the default shell with 192 × 768 cells. The boundaries are deflected exactly as the buoyancy's are, but in whole cells. (B) The index along the plume, the adiabat and the slab. The hot column enters wadsleyite and ringwoodite deeper and bridgmanite shallower than the adiabat, the cold column the reverse. Script: docs/scripts/fig_phase_changes_sections.jl.
Phase buoyancy
The density enters through smooth phase functions (Christensen & Yuen 1985),
with
| symbol | meaning | in the code |
|---|---|---|
| lithostatic pressure of the cell | mantle_pressure(depth, cfg) | |
| transition pressure at the reference temperature, | mantle_pressure(z_k, cfg), plus the optional basalt shift | |
| cell temperature as stored on the grid | Tg | |
| pivot temperature, at which the boundary sits exactly at | mat.clap_T_ref_* | |
| Clapeyron slope | mat.gamma_* | |
| pressure half-width of the tanh | _clap_width | |
| fraction of material in the high-pressure phase, 0 above, 1 below | phase_fraction | |
| density increase across the transition | mat.drho_* | |
| mean of | mean(Γ, dims=2) (2-D), dims=(2,3) (3-D) |
The argument of the tanh is the pressure distance of the cell from its own deflected boundary,
| transition | depth | fields | |||
|---|---|---|---|---|---|
| 410 km analogue, exothermic | 453 km | 1600 K | 180 | mat.clap_depth_410, gamma_410, clap_T_ref_410, drho_410 | |
| 520 km analogue | 520 km | 1600 K | 100 | mat.clap_depth_520, gamma_520, clap_T_ref_520, drho_520 | |
| 660 km analogue, endothermic | 730 km | 1900 K | 400 | mat.clap_depth_660, gamma_660, clap_T_ref_660, drho_660 | |
| post-perovskite | cfg.ppvDepth_km (2700 km) | cfg.ppvClapeyron ( | 1600 K | 50 | cfg.ppvDepth_km, cfg.ppvClapeyron, mat.clap_T_ref_ppv, mat.ppv_drho |
The default depths 453 and 730 km are the Earth transition pressures mapped through Venus gravity (config/MaterialProperties.jl), and the density jumps follow Tian et al. (2023) Table A.1. The phase index and the latent heat use the same table. For an Earth model set mat.clap_depth_410 = 410e3 and mat.clap_depth_660 = 660e3. The 660 km slope is a sensitivity parameter: published values span roughly
Which terms are active.
| flags | transitions in the buoyancy |
|---|---|
cfg.useClaperonBuoyancy = true | 410 and 660 analogues |
cfg.usePhaseTransitionDensity = true (default) and a phase field, i.e. cfg.useMeltingPhase = true | 520 analogue; the 410 and 660 analogues as well if the Clapeyron term is off; post-perovskite if cfg.usePostPerovskite |
Each transition is counted once. useClaperonBuoyancy and useMeltingPhase both default to false, so a default run has no phase buoyancy. With cfg.compClapeyron_dP_410 and compClapeyron_dP_660 the 410 and 660 transition pressures of the Clapeyron term shift by that many pascals per unit basalt fraction (zero by default).
Width. The real transitions are a few kilometres wide, below any convection cell, so mat.clap_width_Pa = 0 (default) it is derived from the mesh so that the 10-90 % width spans mat.clap_width_cells (default 3) radial cells at each transition's own depth, _clap_width), where grid.drVec at mantle_pressure), evaluated at mat.clap_width_Pa fixes it. The code warns once when the 660 km transition spans fewer than two cells.
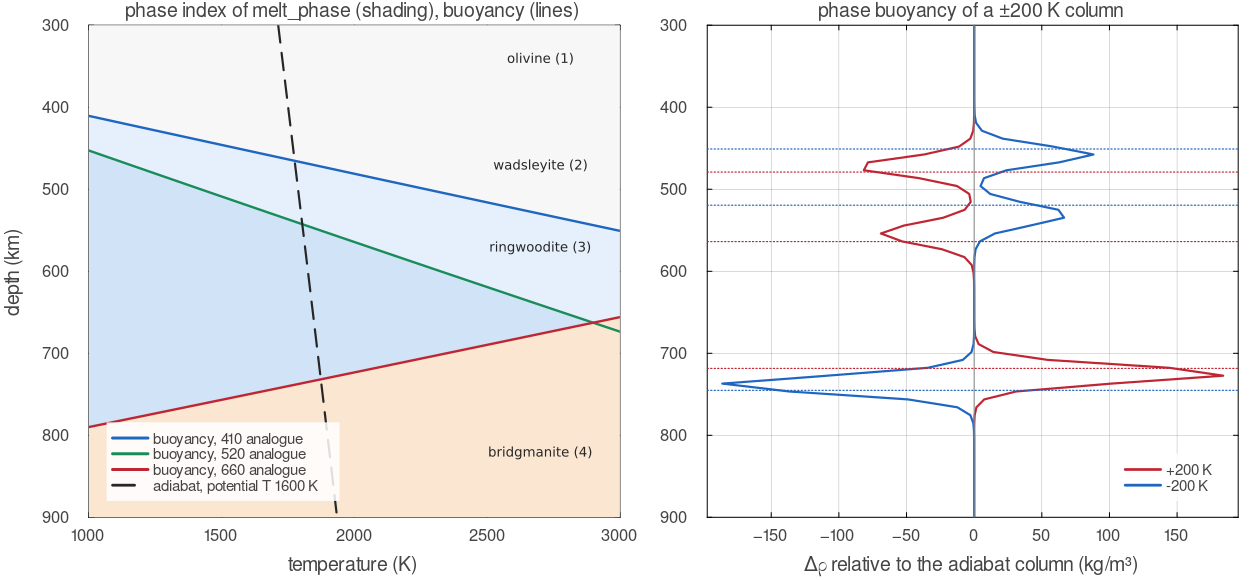
Left: the phase index returned by melt_phase on a grid of depth and temperature (shading), with the compute_buoyancy (Clapeyron plus 520 km terms) for columns 200 K warmer and colder than an adiabatic column, relative to it, on a 300-cell radial grid. Dotted lines: the deflected boundaries. The exothermic 410 and 520 km analogues make the hot column lighter, the endothermic 660 km analogue makes it denser.
Basalt to eclogite
Basalt (the marker field basalt, projected to the cells) transforms to eclogite below cfg.eclogiteTransitionDepth (60 km) over a 20 km ramp:
with cfg.basaltDensityAnomaly (200 kg mcfg.useEclogiteKinetics = true (default false), eclogite above cfg.eclogiteBackT_K (1000 K) over cfg.eclogiteBackWidth_K (100 K):
The same 20 km ramp defines the crust fraction used for crustal buoyancy and viscosity (Buoyancy and composition). The transition carries no latent heat. Its consequences for the melt cycle are on the Melting page.
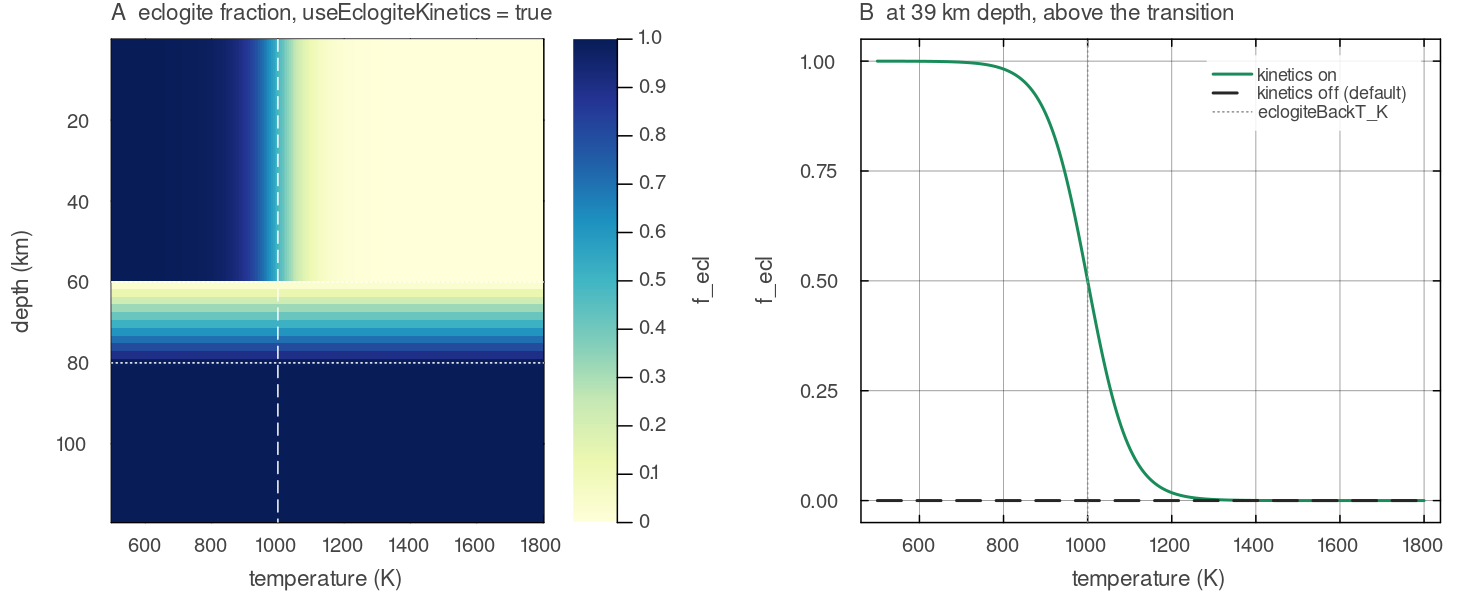
(A) compute_buoyancy (compositional part divided by cfg.basaltDensityAnomaly) for a basalt fraction of 1, with cfg.useEclogiteKinetics = true. Below 80 km the basalt is fully eclogite, across the 60 to 80 km ramp (dotted) it follows the depth, and above 60 km it stays eclogite while colder than about 1000 K (dashed, cfg.eclogiteBackT_K). (B) The same at 43 km. With the option off (the default) basalt above the transition is never eclogite, and with it on the fraction falls from 1 to 0 over about ±200 K around 1000 K. 1500 radial cells. Script: docs/scripts/fig_phase_changes_sections.jl.
Latent heat
Both latent-heat sources are volumetric rates added to the energy equation; melt_phase returns their sum when cfg.useMeltingPhase = true. They are evaluated from the temperature at the start of this step and of the previous one, and the driver rescales the rate by
Melting
with cfg.latentHeatMelt (melt_phase (linear between the Hirschmann solidus and the Andrault liquidus, see Melting). Melting cools, freezing heats. cfg.trackBasalt and cfg.useHeatPipe, 2-D), it books basalt_evolution!), and cfg.meltExtractMaxDepth_km so the two do not count the same melt.
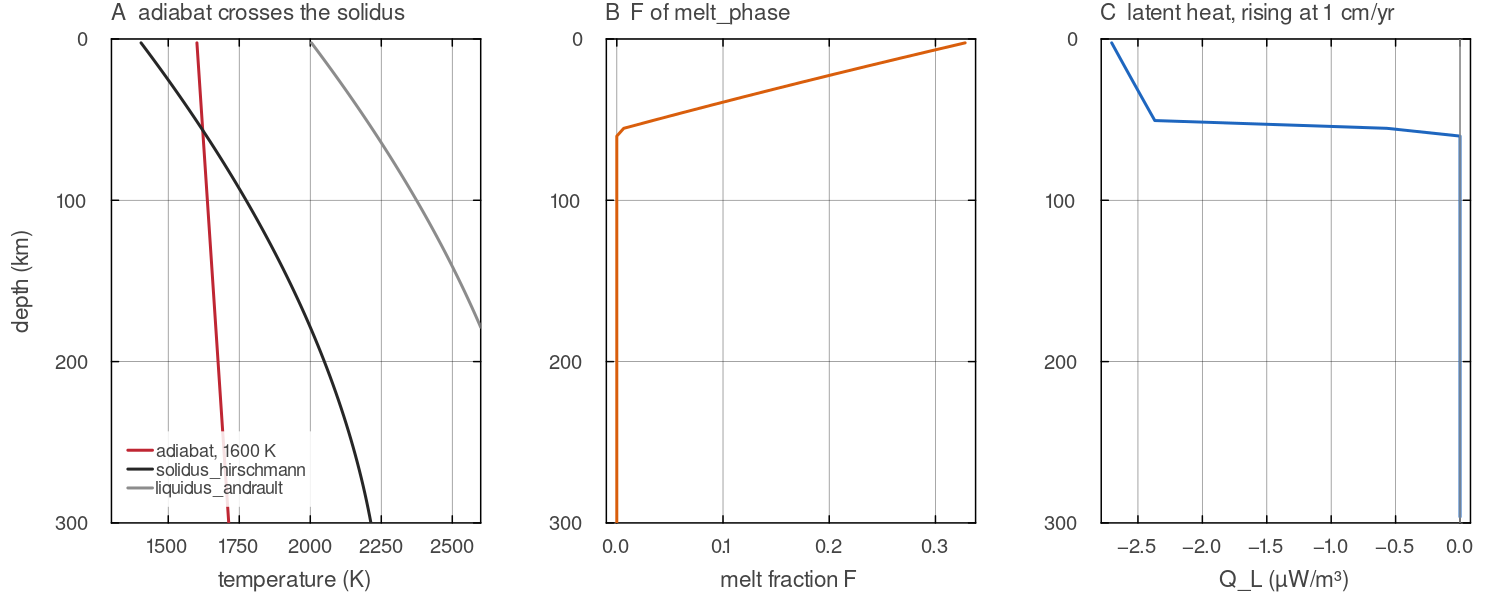
A column on the code's 1600 K adiabat rising at 1 cm/yr, with steady temperature so that only the advective part of solidus_hirschmann near 55 km (liquidus_andrault in grey). (B) The grid melt fraction of melt_phase rises to 0.33 at the surface. (C) melt_phase is negative wherever cfg.trackBasalt = false). Default shell, 600 radial cells. Script: docs/scripts/fig_phase_changes_sections.jl.
Solid-state transitions
With cfg.usePhaseLatentHeat = true (default false) each transition contributes
with
| transition | sign of | |
|---|---|---|
| 410 km | heating (exothermic) | |
| 520 km | heating | |
| 660 km | cooling (endothermic) | |
post-perovskite (with cfg.usePostPerovskite) | heating |
With the flag off, melt_phase instead counts integer phase-index changes between the two temperature fields and books
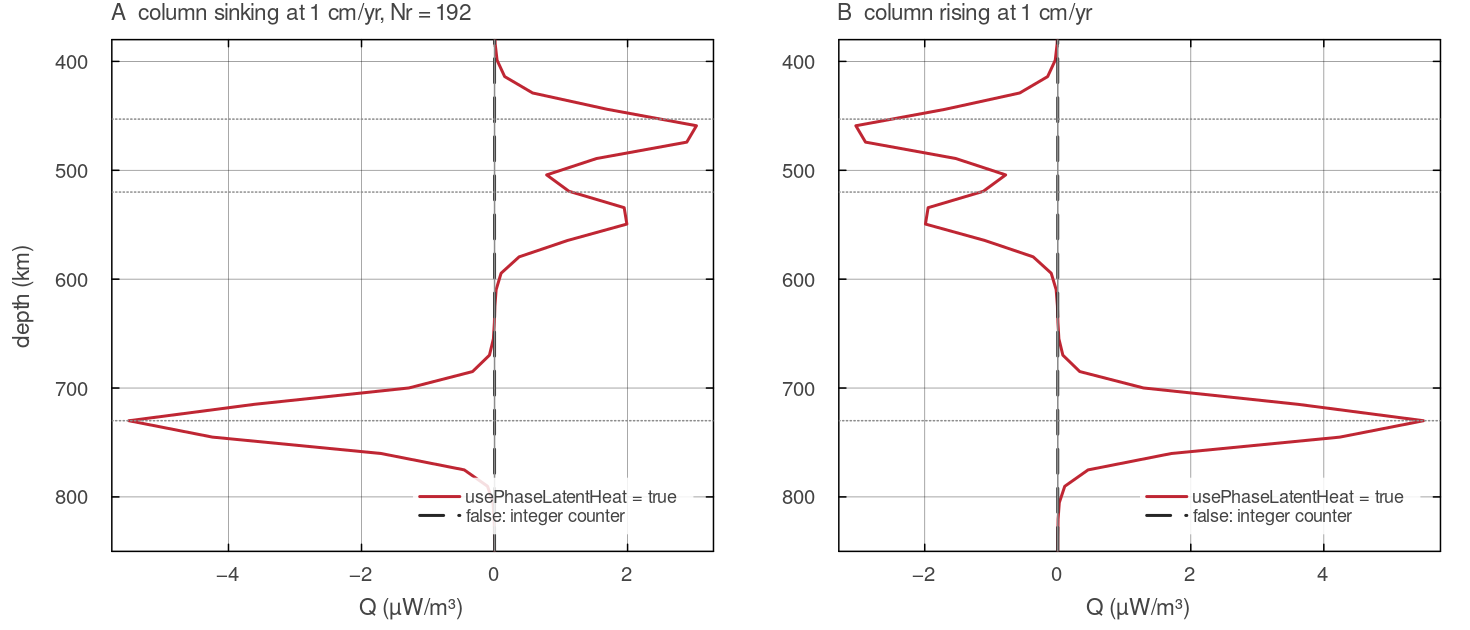
melt_phase for a column on the 1600 K adiabat sinking (A) and rising (B) at 1 cm/yr, with steady temperature, on the default shell with 192 radial cells. With cfg.usePhaseLatentHeat = true the sinking column is heated at the 410 and 520 km analogues and cooled at the 660 km analogue (about −5.5 µW/m³), the rising one the reverse; each peak has the mesh-derived width of the buoyancy. With the flag off the integer counter returns zero everywhere, because no cell changes its phase index while the temperature is steady. Script: docs/scripts/fig_phase_changes_sections.jl.
Assumptions and simplifications
Univariant boundaries. Each transition is a single line in pressure-temperature space for one component. Real mantle transitions are divariant loops in a multicomponent rock, and near 660 km the garnet component transforms in parallel with ringwoodite. The tanh width stands for all of this, and it is set by the mesh rather than by the mineralogy.
Pressure is lithostatic. The boundaries are located on the reference hydrostat, so dynamic pressure does not move them. The built-in reference densities that set the hydrostat carry no phase jumps; a Perple_X reference table (
cfg.referenceTable) supplies its own pressure profile.Buoyancy only. The phase functions change the density in the momentum equation. They do not change the viscosity, thermal expansivity, heat capacity or conductivity. A viscosity increase into the lower mantle is a separate, depth-fixed option on the Rheology page (
cfg.use660kmJump).One description of each boundary. The buoyancy, the phase index and the latent heat read the same depths, slopes and pivots (
phase_transitions), and the buoyancy and the latent heat the same mesh-derived width. A wide width on a coarse grid therefore spreads the latent heat as far as the buoyancy, and transitions closer together than their widths (the 453 and 520 km analogues) overlap in both. The one exception is the optional basalt shift of the 410 and 660 transition pressures (cfg.compClapeyron_dP_410,_660, zero by default), which moves the buoyancy's boundary only.Latent heats are independent parameters. The values
are fixed in melt_phaseand are not derived fromand . With the default slopes and density jumps, = 3300 kg m and 1600 K, the Clausius-Clapeyron relation would give about 66, 59 and kJ kg for the 410, 520 and 660 km transitions, against the 150, 100 and kJ kg in the code. Eclogite by depth. The basalt-to-eclogite transition depends on depth only, not on temperature or reaction time, apart from the optional cold metastable eclogite above the transition. Metastable basalt below it is not modelled.
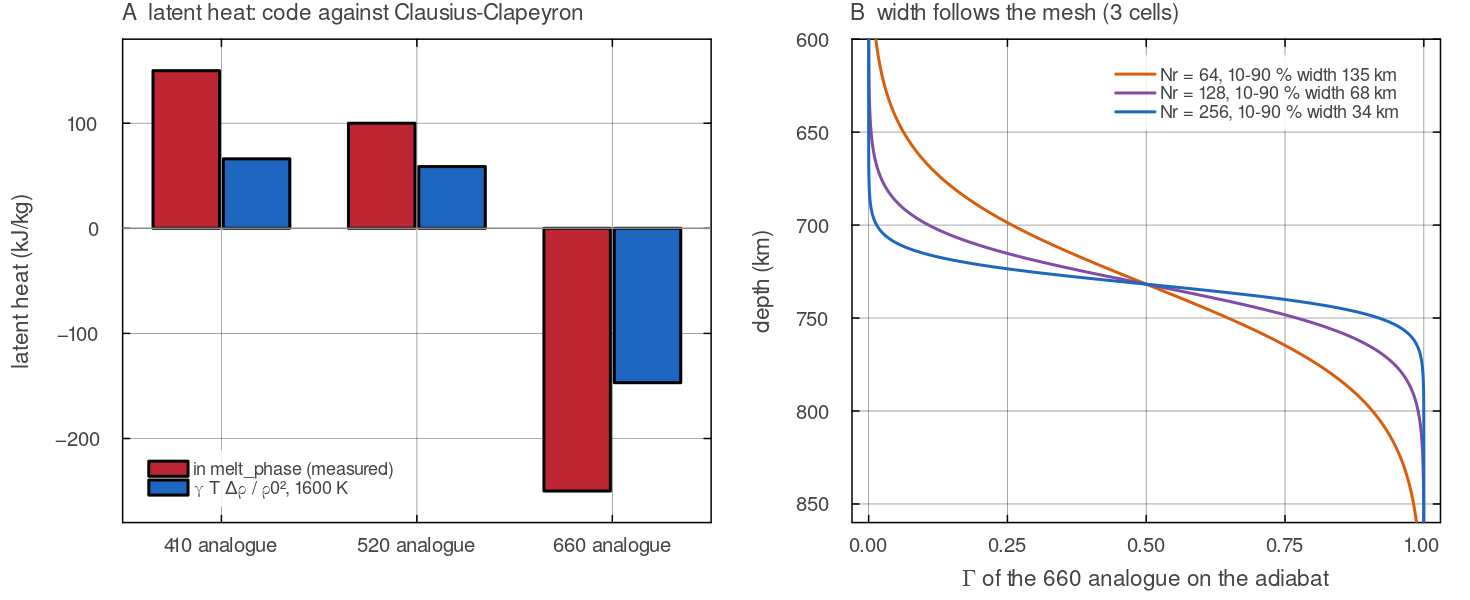
(A) The latent heats fixed in melt_phase (measured as in the latent-heat figure above) against docs/scripts/fig_phase_changes_sections.jl.
2-D and 3-D
| 2-D annulus | 3-D Yin-Yang | |
|---|---|---|
| phase index | yes | yes |
| phase buoyancy, mesh-derived width | yes, lateral mean over | yes, lateral mean over |
| eclogite gate and kinetics | yes | yes |
| crust term using the eclogite ramp | yes | no |
| advective part of | upwind, radial and azimuthal | upwind, radial only |
| advective part of | centred, radial only | centred, radial only |
| latent heat of melting on the grid | zeroed above the extraction depth when the marker heat pipe is on | everywhere (no marker heat pipe in 3-D) |
Under ALA and TALA the driver replaces the thermal buoyancy with its reference-state form and keeps the phase and compositional terms of compute_buoyancy unchanged (Buoyancy and composition).
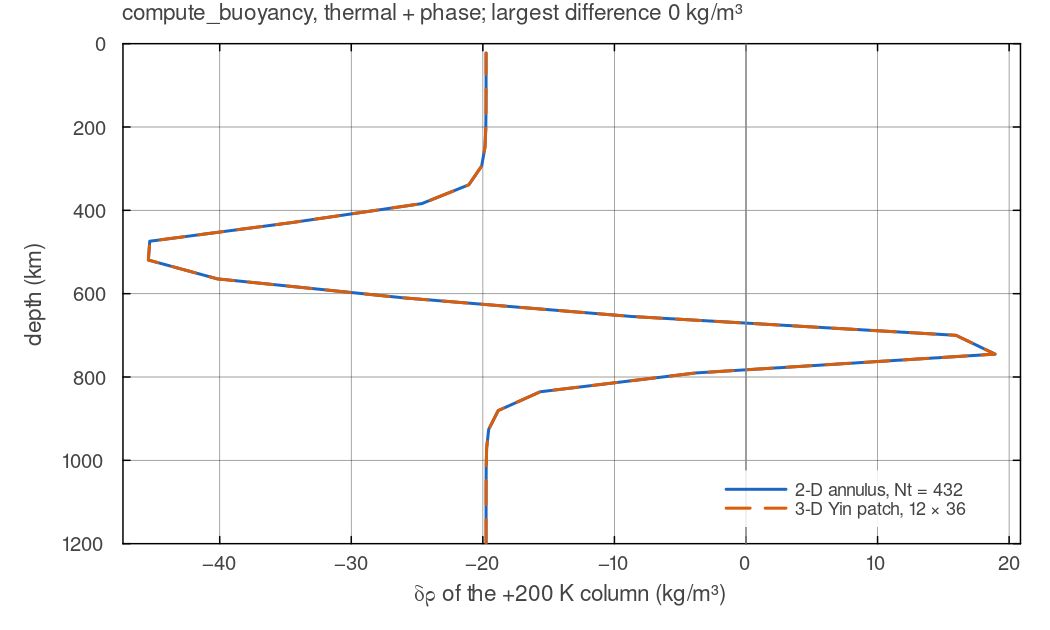
The thermal and phase density of one column 200 K hotter than the 1600 K adiabat, from the 2-D dispatch of compute_buoyancy on an annulus of 432 columns and from the 3-D dispatch on a Yin patch of 12 × 36 columns, so that both lateral means are taken over 432 cells. Clapeyron buoyancy on, 64 radial cells on the default shell. The two profiles agree to the last bit. Script: docs/scripts/fig_phase_changes_sections.jl.
Configuration
| field | default | meaning |
|---|---|---|
cfg.useMeltingPhase | false | compute melt fraction, phase index and latent heat (melt_phase) |
cfg.useClaperonBuoyancy | false | 410 and 660 analogues in the buoyancy |
cfg.usePhaseTransitionDensity | true | smooth 520 km (and post-perovskite) terms when a phase field exists |
cfg.useEarthPhaseBoundaries | true | assign phases 2 to 4 in the phase index |
cfg.usePostPerovskite | false | post-perovskite in the phase index, buoyancy and latent heat |
cfg.ppvDepth_km, cfg.ppvClapeyron | 2700 km, | post-perovskite reference depth and slope |
cfg.usePhaseLatentHeat | false | smooth solid-state latent heat instead of the integer counter |
cfg.latentHeatMelt | latent heat of melting | |
cfg.compClapeyron_dP_410, compClapeyron_dP_660 | 0, 0 Pa | transition shift per unit basalt fraction |
mat.clap_depth_410, clap_depth_520, clap_depth_660 | 453, 520, 730 km | transition depths |
mat.gamma_410, gamma_520, gamma_660 | Clapeyron slopes | |
mat.clap_T_ref_410, clap_T_ref_520, clap_T_ref_660, clap_T_ref_ppv | 1600, 1600, 1900, 1600 K | pivot temperatures |
mat.drho_410, drho_520, drho_660, ppv_drho | 180, 100, 400, 50 kg m | density jumps |
mat.clap_width_Pa, mat.clap_width_cells | 0, 3 | transition width, explicit or in cells |
cfg.eclogiteTransitionDepth | 60 km | top of the 20 km eclogite ramp |
cfg.basaltDensityAnomaly | 200 kg m | eclogite density excess |
cfg.useEclogiteKinetics, eclogiteBackT_K, eclogiteBackWidth_K | false, 1000 K, 100 K | metastable eclogite above the transition |
Where in the code
| What | File, function |
|---|---|
| lithostatic pressure | physics/melt_phase.jl: mantle_pressure |
| phase index, latent heat of melting and of transitions | physics/melt_phase.jl: melt_phase, _phase_index, _radial_column, _advect_upwind, _advect_gamma, _apply_phase_latent! |
| transition table, phase function, phase buoyancy, width, eclogite gate | physics/compute_buoyancy.jl: phase_transitions, phase_fraction, compute_buoyancy, _phase_density, _clap_width, _warn_clap_resolution |
| marker latent heat of melting | physics/basalt_evolution.jl: basalt_evolution! |
| call order, rescaling by | main_SphCon.jl, steps 3 and 4 and the source assembly before diffuse_temperature |
| material defaults | config/MaterialProperties.jl |
Tests
tests/test_phase_transition_resolution.jl: the width is derived from the mesh and spans the requested cells at several resolutions, 2-D and 3-D agree, the buoyancy stays smooth under refinement and is a continuous function of temperature, and each transition is counted once.tests/test_config_timeloop.jl: a run with Clapeyron buoyancy, and the combined configuration, survive the time loop.tests/test_melt_frame.jl:melt_phasecompares the solidus with the real temperature in the potential-temperature frame.tests/test_phase_transition_consistency.jl: every transition parameter is amatfield, a call withoutmatuses its defaults, the width follows the model's pressure and each transition's own depth, the latent heat and phase index sit on the buoyancy's boundary, andmelt_phasemeasures depth fromcfg.R_out.
Key references
Christensen, U. R. & Yuen, D. A. (1985). Layered convection induced by phase transitions. JGR 90, 10291-10300. doi:10.1029/JB090iB12p10291
Ringwood, A. E. (1991). Phase transformations and their bearing on the constitution and dynamics of the mantle. Geochim. Cosmochim. Acta 55, 2083-2110. doi:10.1016/0016-7037(91)90090-R
Murakami, M., Hirose, K., Kawamura, K., Sata, N. & Ohishi, Y. (2004). Post-perovskite phase transition in MgSiO3. Science 304, 855-858. doi:10.1126/science.1095932
Tackley, P. J. (2008). Modelling compressible mantle convection with large viscosity contrasts in a three-dimensional spherical shell using the yin-yang grid. PEPI 171, 7-18. doi:10.1016/j.pepi.2008.08.005
Tian, J., Tackley, P. J. & Lourenço, D. L. (2023). The tectonics and volcanism of Venus: new modes facilitated by realistic crustal rheology and intrusive magmatism. Icarus 399, 115539. doi:10.1016/j.icarus.2023.115539
Further reading
Ahrens, T. J. & Schubert, G. (1975). Gabbro-eclogite reaction rate and its geophysical significance. Rev. Geophys. 13, 383-400. doi:10.1029/RG013i002p00383
Bina, C. R. & Helffrich, G. (1994). Phase transition Clapeyron slopes and transition zone seismic discontinuity topography. JGR 99, 15853-15860. doi:10.1029/94JB00462
Christensen, U. (1995). Effects of phase transitions on mantle convection. Annu. Rev. Earth Planet. Sci. 23, 65-87. doi:10.1146/annurev.ea.23.050195.000433
Dziewonski, A. M. & Anderson, D. L. (1981). Preliminary reference Earth model. Phys. Earth Planet. Inter. 25, 297-356. doi:10.1016/0031-9201(81)90046-7
Faccenda, M. & Dal Zilio, L. (2017). The role of solid-solid phase transitions in mantle convection. Lithos 268-271, 198-224. doi:10.1016/j.lithos.2016.11.007
Hirose, K. (2006). Postperovskite phase transition and its geophysical implications. Rev. Geophys. 44. doi:10.1029/2005RG000186
Ito, E. & Takahashi, E. (1989). Postspinel transformations in the system Mg2SiO4-Fe2SiO4 and some geophysical implications. JGR 94, 10637-10646. doi:10.1029/JB094iB08p10637
Machetel, P. & Weber, P. (1991). Intermittent layered convection in a model mantle with an endothermic phase change at 670 km. Nature 350, 55-57. doi:10.1038/350055a0
Ringwood, A. E. & Green, D. H. (1966). An experimental investigation of the gabbro-eclogite transformation and some geophysical implications. Tectonophysics 3, 383-427. doi:10.1016/0040-1951(66)90009-6
Schubert, G., Turcotte, D. L. & Olson, P. (2001). Mantle Convection in the Earth and Planets. Cambridge University Press. doi:10.1017/CBO9780511612879
Tackley, P. J., Stevenson, D. J., Glatzmaier, G. A. & Schubert, G. (1993). Effects of an endothermic phase transition at 670 km depth in a spherical model of convection in the Earth's mantle. Nature 361, 699-704. doi:10.1038/361699a0