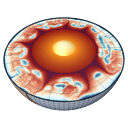
Earth's mantle with mineral-physics properties (2-D)
Earth's whole mantle in the spherical annulus, with the reference state taken from a thermodynamic table of pyrolite and the viscosity from the profile of Steinberger & Calderwood (2006), which is constrained by mineral physics, the geoid and surface observations (Material tables).
300 Myr of the driver at Nr = 64 (64 × 512 cells, 45 km radially): temperature (left) and log₁₀ viscosity (right). Six hot plumes, seeded at the core-mantle boundary, rise through a lower mantle several hundred times stiffer than the upper mantle; cold sheets descend from the top boundary layer between them.
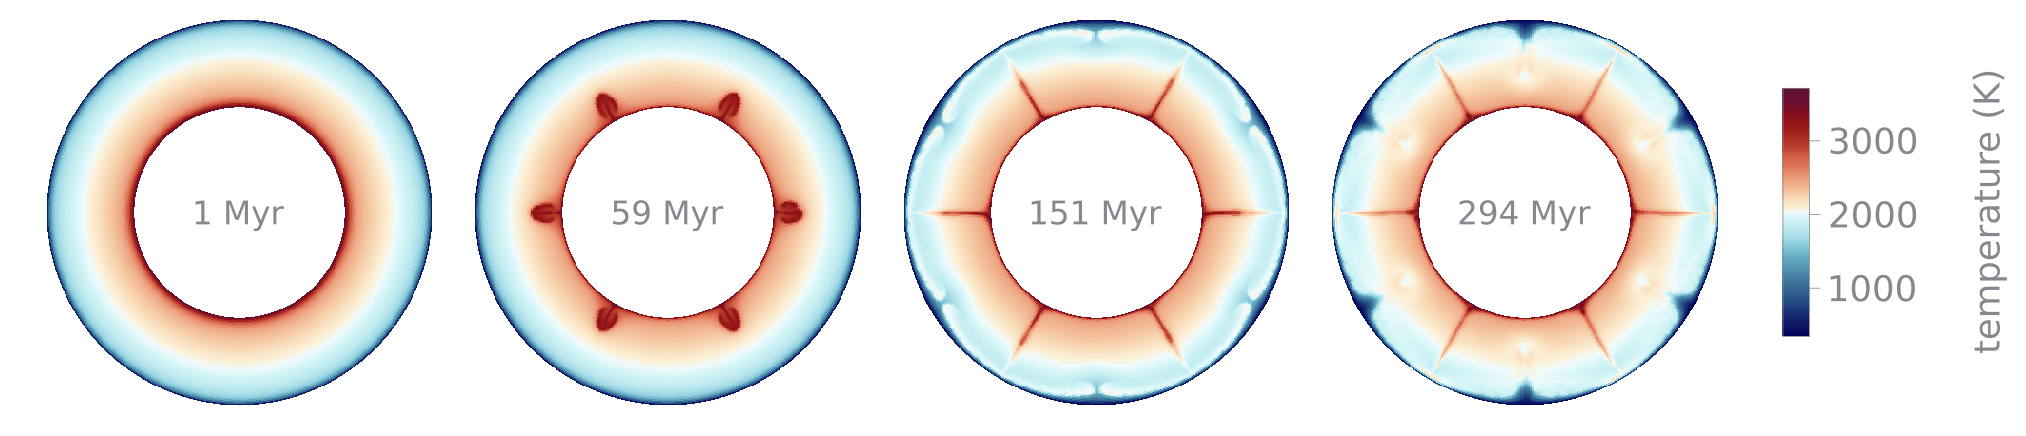
The same run at 1, 59, 151 and 294 Myr.
The model
| shell | |
| walls | 273 K at the surface, 3773 K at the core-mantle boundary |
| reference state | anelastic liquid (ALA), with mass conservation cfg.referenceTable); 2503 K and 135.5 GPa at the core-mantle boundary |
| energy | adiabatic heating and viscous dissipation, together (cfg.useShearHeating) |
| viscosity | |
| initial state | the table adiabat with a 100 km cold boundary layer at the top, a 150 km hot one at the bottom, six 50 K warm seeds at the CMB, 5 K noise |
| run | 300 Myr; Nr = 64 by default |
With an upper bound of
Measured on the run above: rms velocity about 1 to 2 cm/yr, surface heat flow 37-50 mW m⁻² and core heat flow 180-200 mW m⁻² after the start-up, both still changing at 300 Myr. The core heat flow is high because the conductivity at the base of the mantle is diagnostics.csv stays below 0.09 of the surface power in every 100-step window except one, −0.46 at step 500, when the first plumes reach the top boundary layer and the velocity peaks at 7.5 cm/yr. This is a 300 Myr start-up on a coarse grid, a demonstration of the material model, not a statistically steady Earth.
Running it
export GKSwstype=nul
julia --project=. -t 4 examples/annulus_earth_steinberger_2d.jl 64
The argument is Nr (Nt = 8 Nr). The run above took 58 minutes on 2 threads (2615 steps). The same knobs as every example apply: MILEVA_MAXTIME_MYR, MILEVA_MAXSTEPS, MILEVA_OUTDIR, MILEVA_VTKEVERY. The animations were rendered with docs/scripts/render_annulus_gif.jl output/docs_short/earth temperature ... (and viscosity).
Simplifications
Two-dimensional: the spherical annulus, not a three-dimensional shell.
Anelastic liquid approximation with the reference density along the table adiabat; the heat capacity is constant (
CP_REF) and gravity is constant, 9.81 m s⁻².Phase transitions enter through the reference profile only, not as lateral density changes.
References
Steinberger, B. & Calderwood, A. R. (2006), Geophys. J. Int. 167, 1461-1481, doi:10.1111/j.1365-246X.2006.03131.x. The data sources of the table are on the Material tables page.