Free surface and isostasy
MILEVA's top boundary is the fixed sphere
| option | switch | changes the Stokes solution | output |
|---|---|---|---|
| sticky air | cfg.useStickyAir | yes: a weak, buoyancy-free layer inside the domain | the flow itself |
| kinematic surface tracker | cfg.useFreeSurface | no | internal deflection field |
| relaxed isostatic topography | cfg.useIsostasy | no | internal deflection field |
All three default to false.
Physical background
Free surface and free slip
The surface of a planet is a free surface. Nothing above it (vacuum, an atmosphere or an ocean) can exert a shear stress worth mentioning on the rock, and the boundary moves with the material that forms it. Mathematically that is two conditions. The traction on the surface vanishes,
Most global convection models replace this with free slip on a fixed sphere: zero shear traction but zero normal velocity. The reason is scale. Surface topography on Earth and Venus is a few kilometres, while the mantle is close to 3000 km deep, so the shape of the domain hardly changes. The flow still pushes on the rigid lid of the domain, and the normal stress it exerts there is the stress a real surface would have to balance with its own weight. Converting one into the other gives the classic estimate of dynamic topography (Hager et al. 1985; Zhong, Gurnis & Moresi 1996),
where
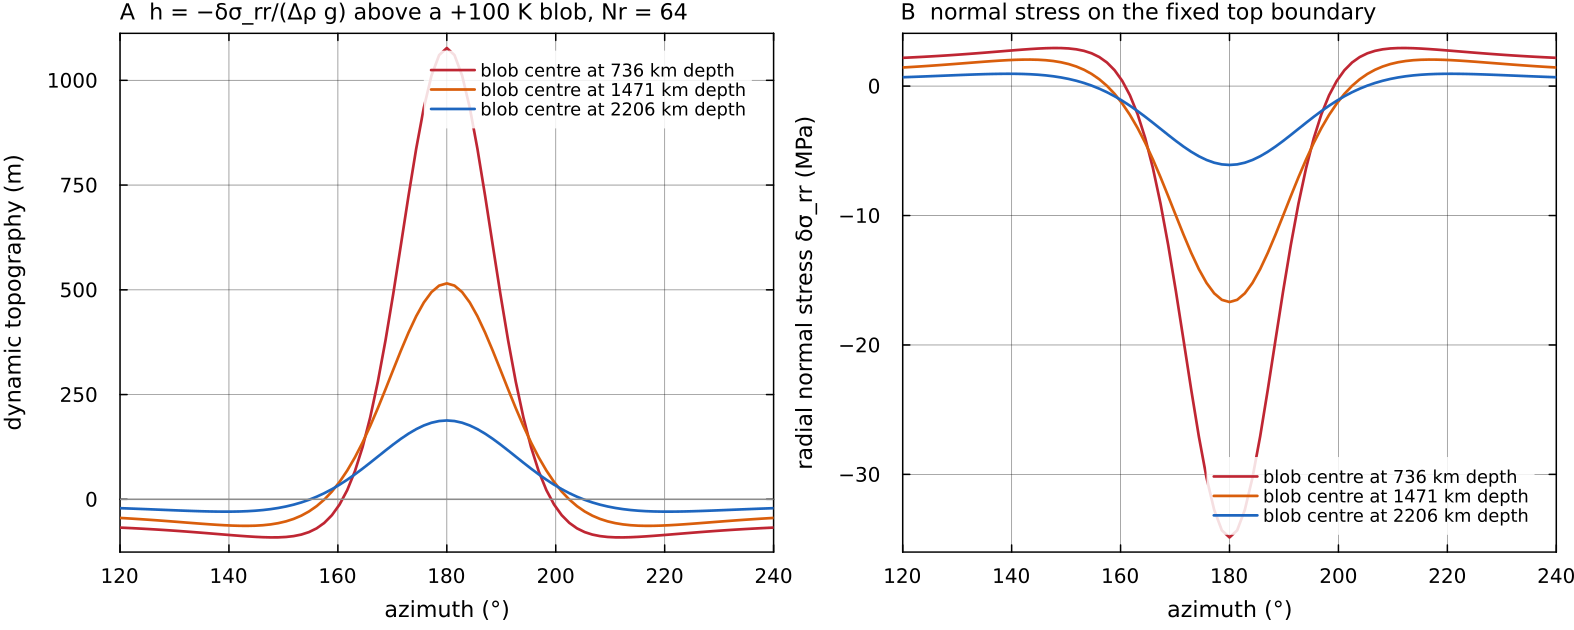
The classic estimate evaluated on a free-slip Stokes solution, as a post-processing illustration (no MILEVA option computes it): assemble_stokes on a Venus-sized spherical annulus, 64 × 256 cells, Boussinesq, docs/scripts/fig_free_surface_sections.jl.
Isostatic and dynamic topography
Topography is supported in two broad ways. Isostatic topography floats. A column of lithosphere that is lighter than its neighbours stands higher, one that is heavier stands lower, and below some compensation depth the pressure is the same everywhere. Airy compensation achieves this with thickness changes of a light crust (mountains with roots), Pratt compensation with lateral density changes at fixed thickness, and flexural compensation spreads the load over a region through the bending strength of an elastic plate (Watts 2023). Dynamic topography is held up or pulled down by the stresses of the flow beneath the lithosphere and disappears when that flow stops.
Thermal isostasy is the example that matters most for a convecting planet. A conductive lid is colder, and therefore denser, than the mantle beneath it. Where the lid is thicker the column carries more mass and sinks. This is why the ocean floor deepens as the plate ages and thickens, roughly with the square root of age (Parsons & Sclater 1977). For a lid with a linear temperature profile from
With isostasy measures density against the mean of each radial row, and that mean already contains part of the thick lid.
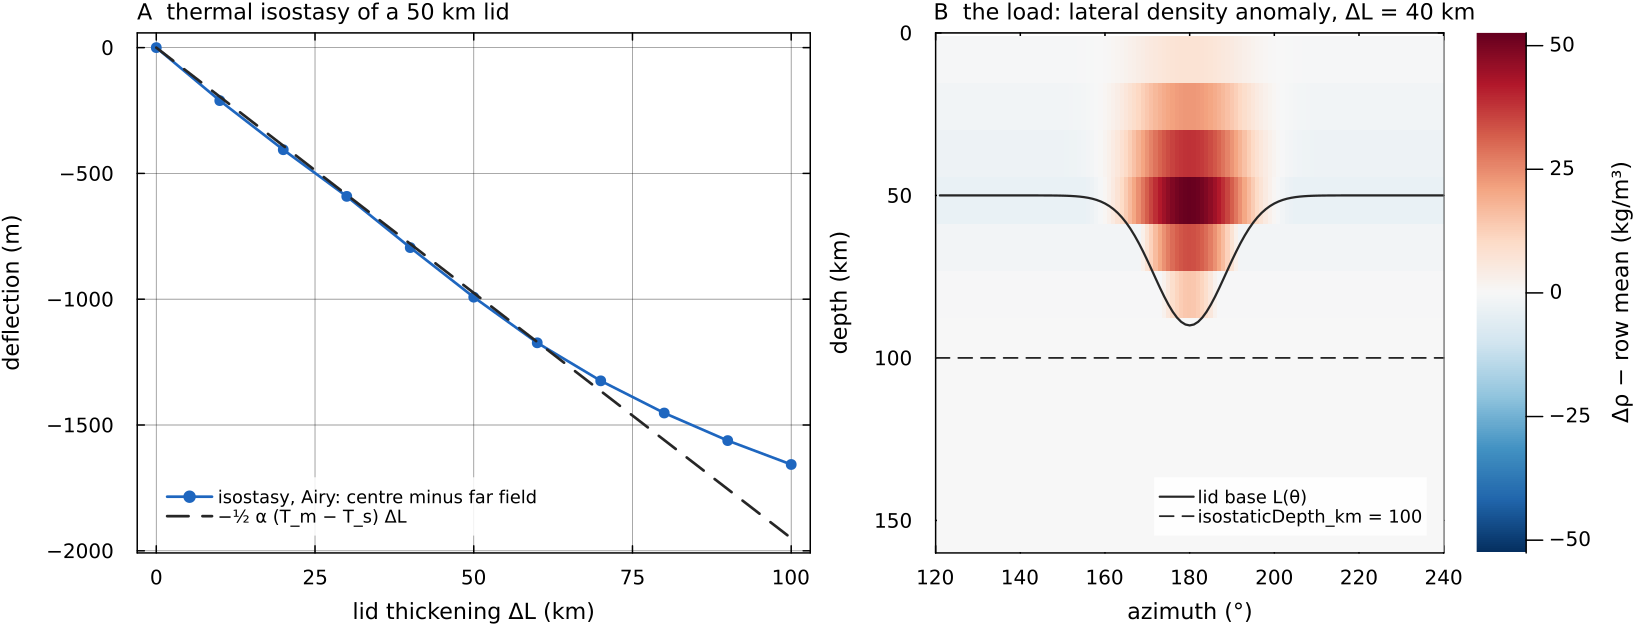
A: the Airy equilibrium of isostasy at the lid centre, relative to the far field, for a 50 km conductive lid thickened by 0 to 100 km (200 × 360 annulus), against isostasy counts only the top 100 km. B: the load for docs/scripts/fig_free_surface_sections.jl.
How fast topography relaxes
A surface that is out of equilibrium relaxes by viscous flow of the mantle below it. For a Newtonian half-space of viscosity
(Haskell 1935; Turcotte & Schubert 2014). With
The same short relaxation time makes a truly free surface awkward to compute. If a time step is longer than the relaxation time of the shortest resolved wavelength, an explicit update overshoots, and the surface swings up and down with growing amplitude from step to step. Kaus, Mühlhaus & May (2010) named this the "drunken sailor" instability and proposed the stabilisation that free_surface borrows in a simplified form.
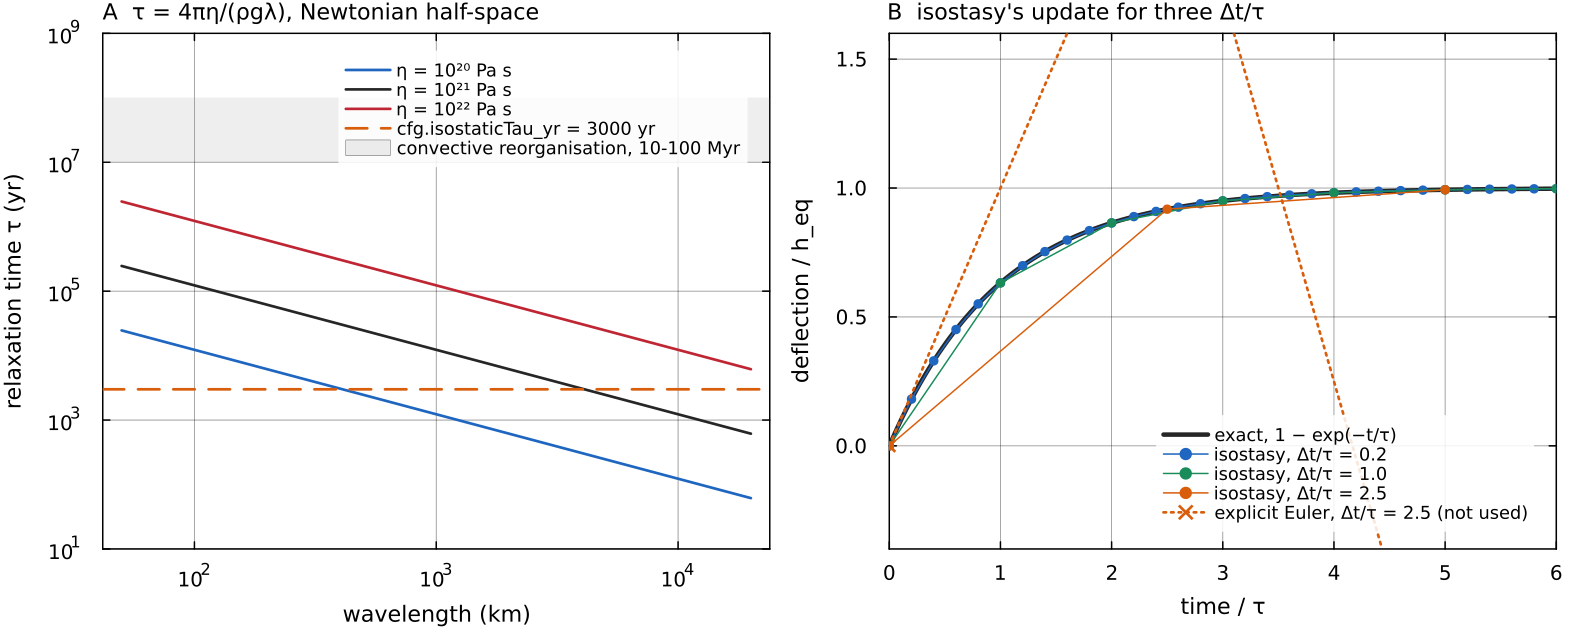
A: the half-space relaxation time isostaticTau_yr and the time over which convection reorganises. B: the deflection at the centre of the thickened lid stepped by isostasy with docs/scripts/fig_free_surface_sections.jl.
Flexure
An elastic plate of thickness
(Watts 2023). Long loads (
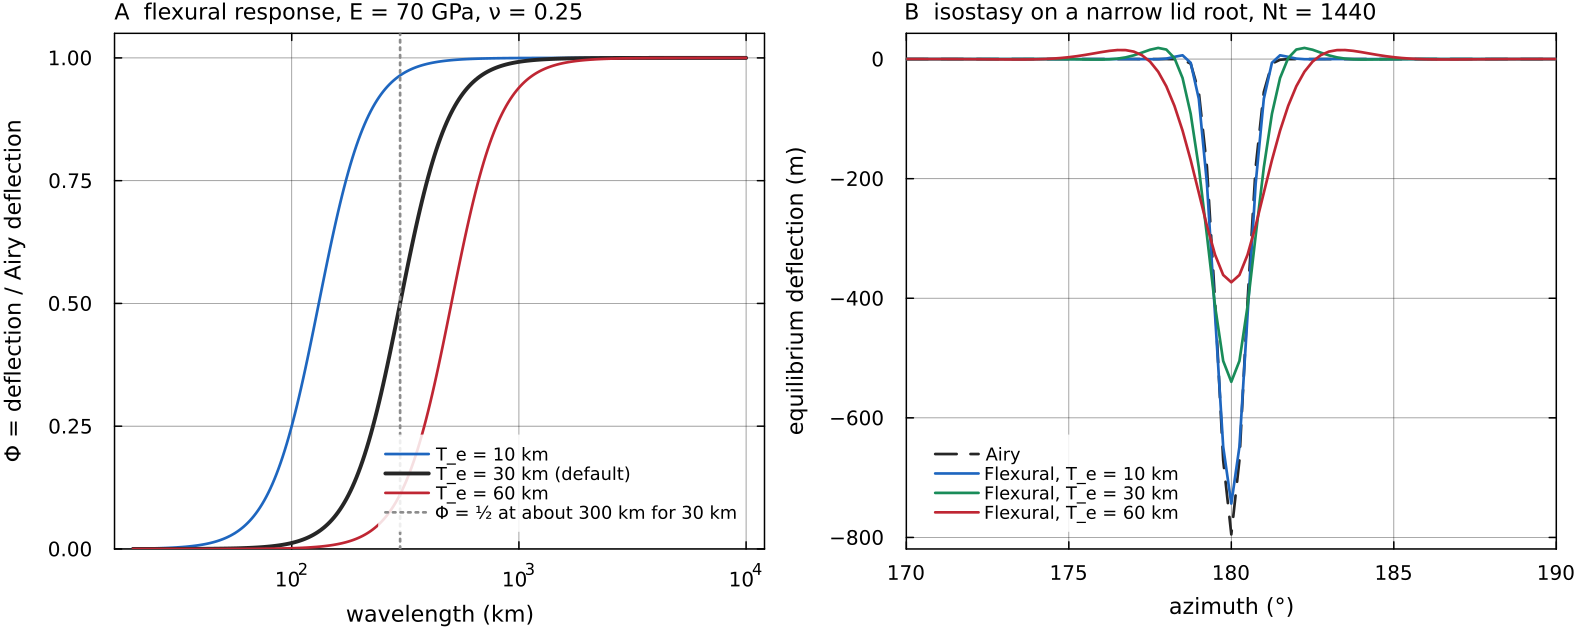
A: the response isostasy in Airy and in Flexural mode on a lid root about 70 km wide, on a 200 × 1440 annulus. The flexural branch calls a Fourier transform; FFTW is not a dependency of the repository, so the script supplies a plain discrete transform under the name the code looks for, and the spectral solve itself is MILEVA's. A 10 km plate barely changes the Airy answer, a 60 km plate halves the depression, spreads it and raises a small flexural bulge on each side. Script: docs/scripts/fig_free_surface_sections.jl.
Scales and typical values
Three ratios decide which approximation is adequate:
, the time step against the relaxation time. When it is large the surface reaches equilibrium within each step; when it is of order one or larger for a resolved wavelength, an explicit free surface needs stabilisation.
, topography against its wavelength. Small values justify a fixed mesh with the deflection treated as a small perturbation (Zhong, Gurnis & Moresi 1996 find their fixed-grid free surface accurate in this limit).
, the sticky-air criterion of Crameri et al. (2012), discussed under Sticky air.
| quantity | value | source |
|---|---|---|
| observed dynamic topography, Earth, ~10³ km wavelength | typical peak amplitude ±1 km | Hoggard, White & Al-Attar 2016 |
| observed dynamic topography, Earth, ~10⁴ km wavelength | peak amplitude about ±500 m | Hoggard, White & Al-Attar 2016 |
| Venus hypsometry | unimodal; more than 80 % of the surface lies within 1 km of the 6051.84 km mean radius | Ford & Pettengill 1992 |
| Venus support of topography | about 10 % of the surface (highland plateaus, tesserae) consistent with crustal-thickness compensation; the remaining 90 % (rises, plains, lowlands) dominated by convective tractions | Simons, Solomon & Hager 1997 |
| Venus elastic thickness | below 20 km at highland plateaus and tesserae when their relief formed; below 30 km at highland rises | Simons, Solomon & Hager 1997 |
| relaxation time, | about 12 000 to 4 100 yr | computed from Haskell (1935) above |
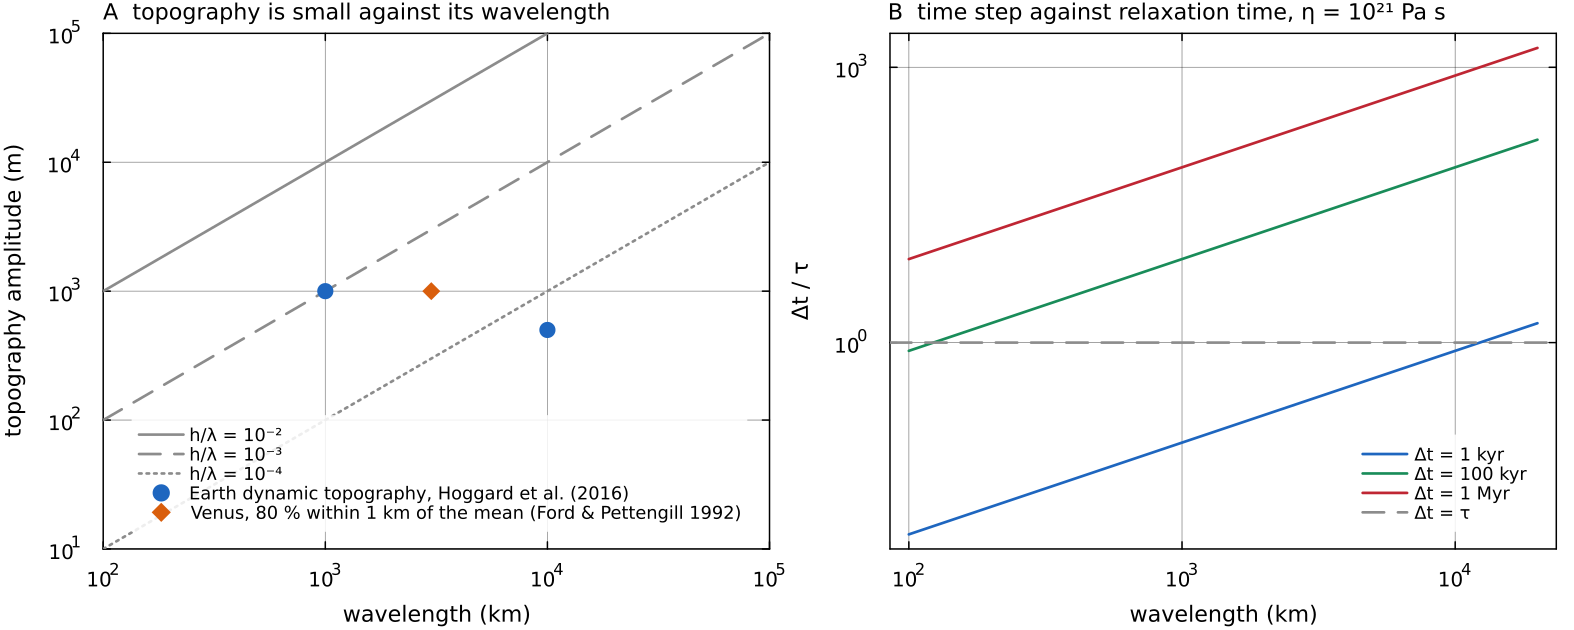
A: the observed amplitudes of the table against their wavelengths, with lines of constant docs/scripts/fig_free_surface_sections.jl.
Sticky air
apply_sticky_air! (utils/sticky_air.jl) overrides every cell whose centre lies within cfg.airThickness (80 km) of cfg.airViscosity (cfg.airDensity (1.0, written into the force-density field, so about 1 N m
Notes on the implementation:
the air layer is a fixed set of whole radial rows, chosen by cell centre; it is not a material, so mantle carried into it takes on air properties and air does not follow the interface;
the layer must be thicker than the top cell or nothing is overridden (the code warns);
the quality of the approximation depends on the air-to-mantle viscosity ratio and the layer thickness (Crameri et al. 2012); the default is
Pa s; test it for the problem at hand.
Why the method works, and when it does not, follows from the relaxation argument above. The air layer must be weak enough that the shear and normal stresses it transmits to the mantle are negligible over the time the surface takes to adjust, and thick enough that it does not itself act as a stiff lid on the flow. Crameri et al. (2012) compared sticky-air topography with true free surfaces in several codes and found the approximation good as long as
is sufficiently small, where
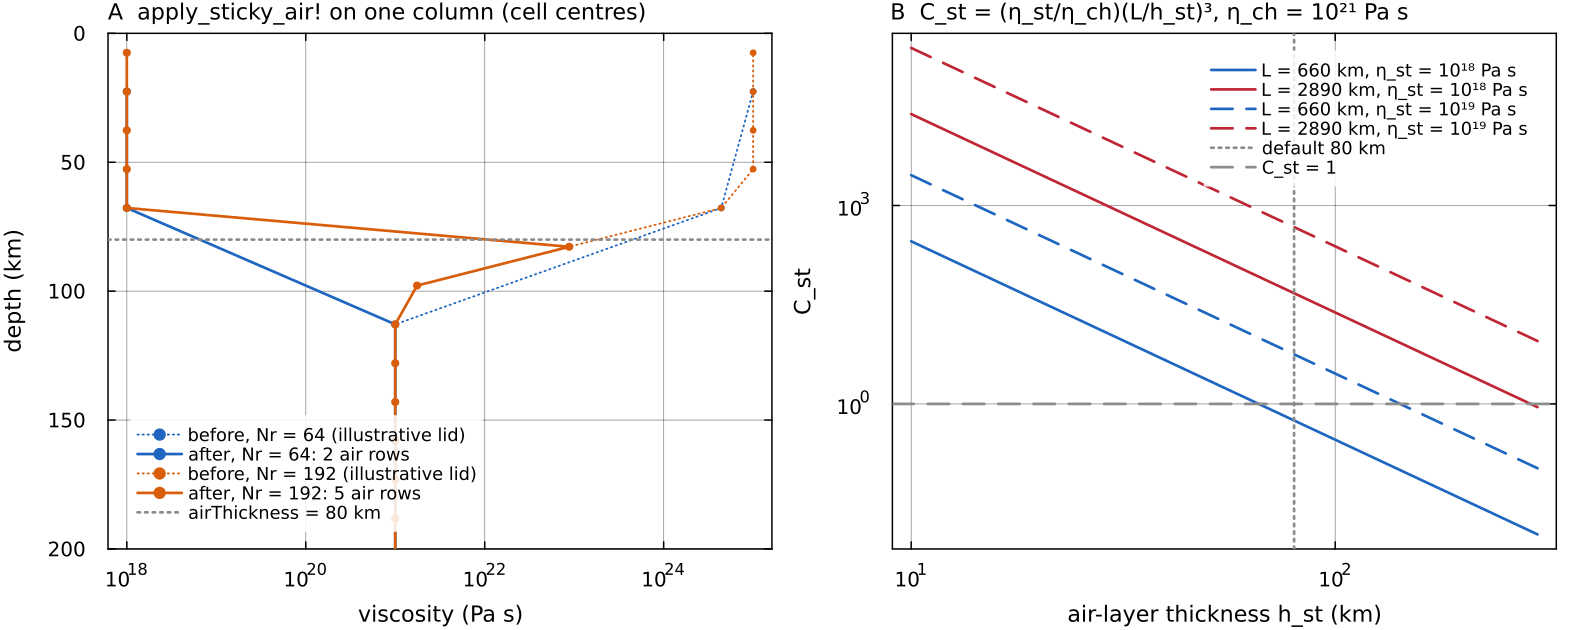
A: apply_sticky_air! on one column of an illustrative lid, at 64 and 192 radial cells (default Earth-sized shell). Whole rows whose centre lies within 80 km of the surface are set to docs/scripts/fig_free_surface_sections.jl.
Kinematic surface tracker
The two deflection options work as a short chain inside each time step. First the tracker reads the flow at the top of the mantle and carries the surface shape with it: it measures how steep the surface is, works out how fast the sideways flow moves that shape (the top face has no vertical velocity, so the flow alone cannot raise or lower the surface), takes a damped step forward in time and filters the result to damp grid-scale wiggles at a rate set by how fast the surface flow crosses a cell. Then the isostasy routine looks down the top 100 km of each column, adds up how much heavier or lighter it is than the average column, turns that excess mass into the height at which the column would float, and lets the surface relax part of the way toward that height. The figure follows one step through both routines for two columns.
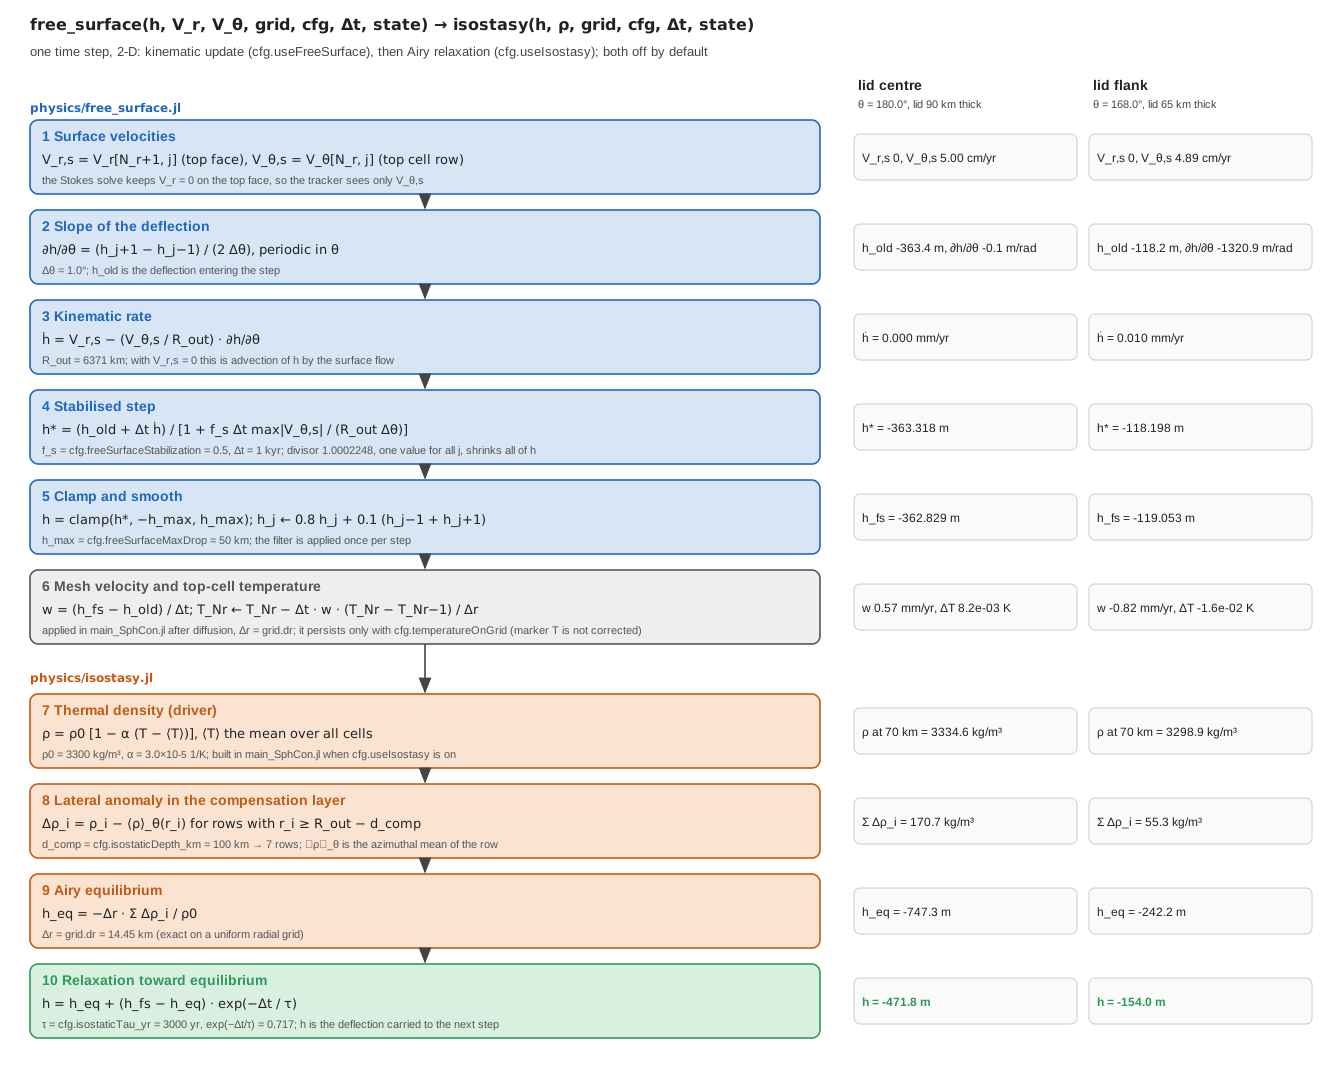
One 1 kyr step of free_surface followed by isostasy in Airy mode, on a 200 x 360 annulus with a conductive lid thickened from 50 to 90 km (the field of the isostasy figure below) and a prescribed surface velocity docs/scripts/fig_free_surface_pipeline.jl.
free_surface (physics/free_surface.jl) advances a surface deflection
where
| symbol | meaning | in the code |
|---|---|---|
| surface deflection above (positive) or below | h_surf in main_SphCon.jl | |
| radial velocity on the top face | Vr[end, :] (2-D), Vr[Nr+1, :, :] (3-D) | |
| tangential velocities in the top cell row | Vt[end, :]; 3-D: Vth averaged to the cell centre, Vph at a | |
| outer radius of the fixed mesh | grid.R_out | |
| surface slopes, centred differences, periodic in the annulus and in | one-sided at the 3-D |
The equation says that the surface height at a fixed angle changes for two reasons: material crossing the surface vertically (
The tracker uses cfg.freeSurfaceStabilization, 0.5), clamped to cfg.freeSurfaceMaxDrop (50 km) and filtered with a three-point (2-D) or five-point (3-D) stencil. The filter is rate based: its weight is chosen so that the grid-scale (two-cell) mode is multiplied by
Two details of this chain are worth stating precisely. First, the stabilisation in Kaus, Mühlhaus & May (2010) is a correction term added to the momentum equation, which accounts for the density that moves across the surface during a time step. MILEVA applies its version to the tracker update only. Since the denominator is larger than 1 whenever the surface moves sideways, it damps the deflection by the same factor everywhere in that step, on top of the advection. Second, free_surface alone, stored as state_fs.w_mesh; the later isostatic adjustment changes grid.r[Nr] - grid.r[Nr-1] (surface_motion_temperature_correction!).
Deformable surface
The Stokes solve keeps useIsostasy. For a mechanically deformable surface use sticky air.
Isostatic topography
isostasy (physics/isostasy.jl) relaxes a surface deflection toward isostatic equilibrium with the density of the top cfg.isostaticDepth_km (100 km). The driver passes a thermal density
Airy (cfg.isostaticMode = "Airy", 2-D and 3-D): local column compensation,
This is the statement that every column carries the same mass above the compensation depth. A column with an excess mass grid.drVec[i]), cfg.isostaticDepth_km, cfg.rho0. A dense (cold, thick) column gives a negative
Flexural ("Flexural", 2-D only): a thin elastic plate solved spectrally in the azimuthal wavenumber
with rigidity cfg.flexuralRigidity, or, when that is 0, cfg.elasticThickness_km (30 km),
In this equation
The topography relaxes toward equilibrium with time constant cfg.isostaticTau_yr (3000 yr):
This is the exact solution over one step of the first-order relaxation law
The load is thermal. The column sum weights each row by its own cell width, so the deflection is the same column integral on uniform and stretched radial grids. The relaxation time is converted to seconds with cfg.SEC_PER_MYR in both 2-D and 3-D. The deflection is a diagnostic of the loop and is not written to the output files.
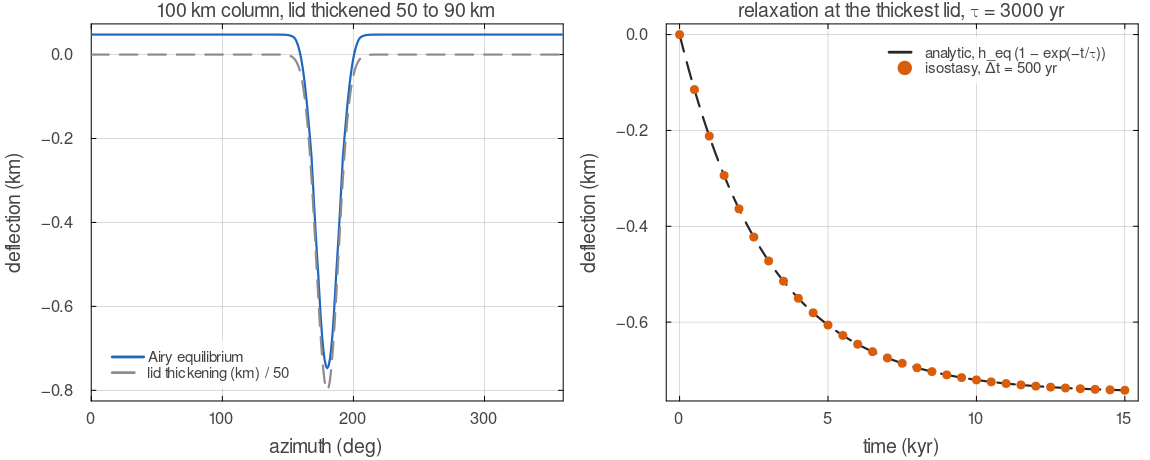
isostasy in Airy mode on a thermal density field whose conductive lid thickens from 50 to 90 km over about 40 degrees of azimuth. Left: the equilibrium deflection, a depression over the thick, dense lid that follows its shape. Right: the deflection at the thickest lid, stepped with 500 yr steps, against the exact exponential approach with the default
Assumptions and simplifications
The mesh and the mechanical boundary stay fixed. The Stokes solve always sees
and free slip on . Of the three options only sticky air changes the flow; the tracker and isostasy compute a deflection that is not fed back into the momentum equation. This is the small-topography limit of the background section, reasonable when and the surface relaxes much faster than the flow evolves. The deflection reaches the temperature field only through the top cell. The tracker's rate
shifts the top-cell temperature as if the surface had moved through the thermal gradient; nothing else in the model sees . Isostatic loads are thermal. The density passed to
isostasyis; composition, melt and phase changes do not enter it, and the material above the surface has zero density. One compensation depth and one relaxation time. Both are constants (
cfg.isostaticDepth_km,cfg.isostaticTau_yr), where in nature the relaxation time depends on wavelength and viscosity.Flexure is that of a thin, flat plate laid around the annulus, with
and fixed in the code and no stresses from the curvature of the shell; it is available in 2-D only.
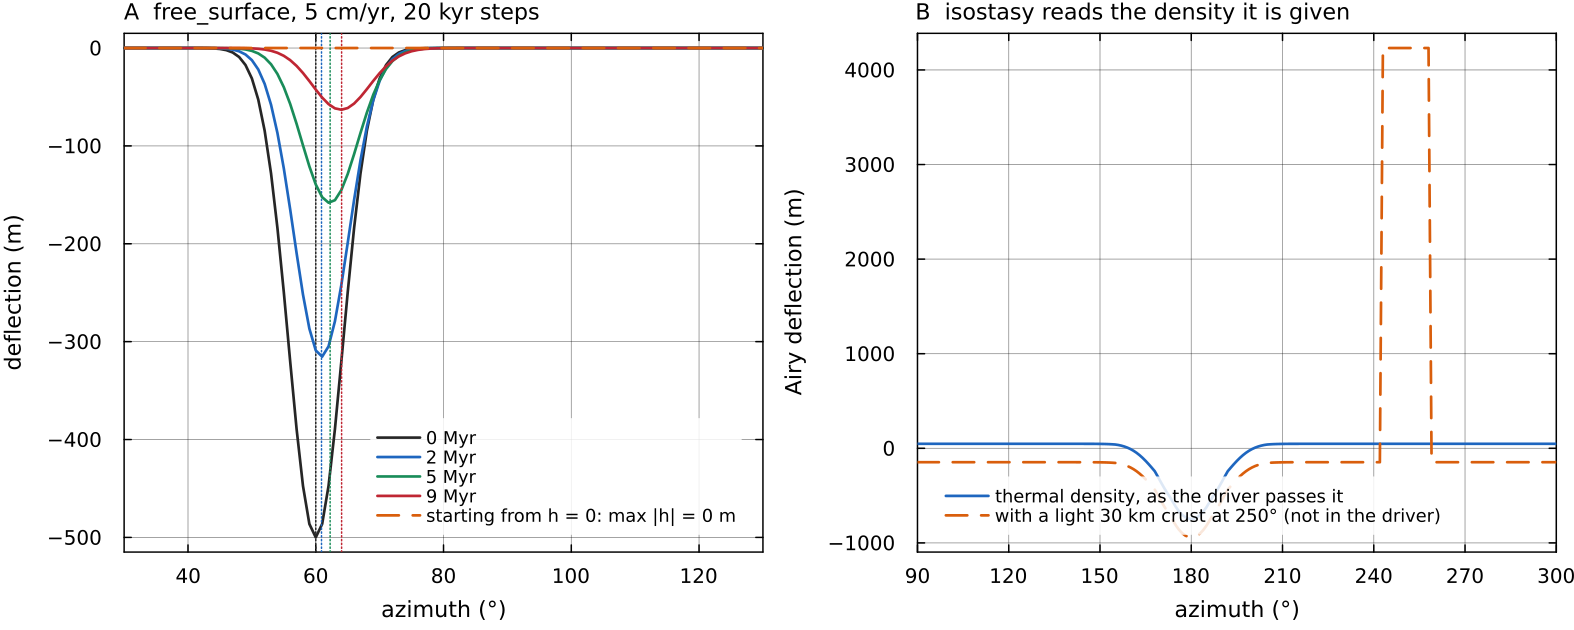
A: free_surface with a uniform 5 cm/yr surface flow and 20 kyr steps on a 64 × 360 annulus, starting from a 500 m depression; dotted lines mark where the flow alone would carry its centre. The deflection moves downstream and decays, because the stabilisation divisor (1.0045 per step here) damps it by a factor e every 4.5 Myr at this speed and cell size. Started from isostasy on the thermal density the driver passes, and on the same field with a 30 km crust 500 kg/m³ lighter added by hand; the driver never supplies the second, so compositional relief does not appear in the deflection. Script: docs/scripts/fig_free_surface_sections.jl.
Configuration
| field | default | meaning |
|---|---|---|
cfg.useStickyAir | false | weak air layer inside the domain |
cfg.airThickness, cfg.airViscosity, cfg.airDensity | 80 km, | air layer |
cfg.useFreeSurface | false | kinematic deflection tracker |
cfg.freeSurfaceStabilization, cfg.freeSurfaceMaxDrop | 0.5, 50 km | tracker stabilisation and clamp |
cfg.useIsostasy, cfg.isostaticMode | false, "Airy" | isostatic deflection |
cfg.isostaticDepth_km, cfg.isostaticTau_yr | 100, 3000 | compensation depth, relaxation time |
cfg.flexuralRigidity, cfg.elasticThickness_km | 0, 30 | plate rigidity (flexural mode) |
Where in the code
| What | File, function |
|---|---|
| sticky air | utils/sticky_air.jl: apply_sticky_air!, sticky_air_mask |
| kinematic tracker, 2-D and 3-D | physics/free_surface.jl: free_surface |
| isostasy, 2-D and 3-D | physics/isostasy.jl: isostasy |
| calls and the top-cell temperature correction | main_SphCon.jl, steps 6, 7 and 13 |
Key references
Schmeling, H. et al. (2008). A benchmark comparison of spontaneous subduction models: towards a free surface. PEPI 171, 198-223. doi:10.1016/j.pepi.2008.06.028
Crameri, F. et al. (2012). A comparison of numerical surface topography calculations in geodynamic modelling: an evaluation of the "sticky air" method. GJI 189, 38-54. doi:10.1111/j.1365-246X.2012.05388.x
Kaus, B. J. P., Mühlhaus, H. & May, D. A. (2010). A stabilization algorithm for geodynamic numerical simulations with a free surface. PEPI 181, 12-20. doi:10.1016/j.pepi.2010.04.007
Turcotte, D. L. & Schubert, G. (2002). Geodynamics, 2nd ed., chapter 3.
Haskell, N. A. (1935). The motion of a viscous fluid under a surface load. Physics 6, 265-269. doi:10.1063/1.1745329
Hager, B. H., Clayton, R. W., Richards, M. A., Comer, R. P. & Dziewonski, A. M. (1985). Lower mantle heterogeneity, dynamic topography and the geoid. Nature 313, 541-545. doi:10.1038/313541a0
Zhong, S., Gurnis, M. & Moresi, L. (1996). Free-surface formulation of mantle convection, I. Basic theory and application to plumes. GJI 127, 708-718. doi:10.1111/j.1365-246X.1996.tb04049.x
Parsons, B. & Sclater, J. G. (1977). An analysis of the variation of ocean floor bathymetry and heat flow with age. JGR 82, 803-827. doi:10.1029/JB082i005p00803
Hoggard, M. J., White, N. & Al-Attar, D. (2016). Global dynamic topography observations reveal limited influence of large-scale mantle flow. Nature Geoscience 9, 456-463. doi:10.1038/ngeo2709
Ford, P. G. & Pettengill, G. H. (1992). Venus topography and kilometer-scale slopes. JGR Planets 97, 13103-13114. doi:10.1029/92JE01085
Simons, M., Solomon, S. C. & Hager, B. H. (1997). Localization of gravity and topography: constraints on the tectonics and mantle dynamics of Venus. GJI 131, 24-44. doi:10.1111/j.1365-246X.1997.tb00593.x
Further reading
Turcotte, D. L. & Schubert, G. (2014). Geodynamics, 3rd edn. Cambridge University Press. doi:10.1017/CBO9780511843877. Isostasy, plate flexure and the viscous relaxation of topography at an introductory level.
Watts, A. B. (2023). Isostasy and Flexure of the Lithosphere, 2nd edn. Cambridge University Press. doi:10.1017/9781139027748. Airy, Pratt and flexural compensation, elastic thickness and the response function in depth.
Schubert, G., Turcotte, D. L. & Olson, P. (2001). Mantle Convection in the Earth and Planets. Cambridge University Press. doi:10.1017/CBO9780511612879. Dynamic topography and the geoid as consequences of mantle flow.
Gerya, T. (2019). Introduction to Numerical Geodynamic Modelling, 2nd edn. Cambridge University Press. doi:10.1017/9781316534243. Numerical treatments of the top boundary, including sticky air and marker-based surface tracking.