Layering by an endothermic phase change (2-D)
A solid-state phase change in the mantle releases or absorbs latent heat and changes the density of the rock that crosses it. Whether the boundary helps or hinders flow depends on the sign of its Clapeyron slope
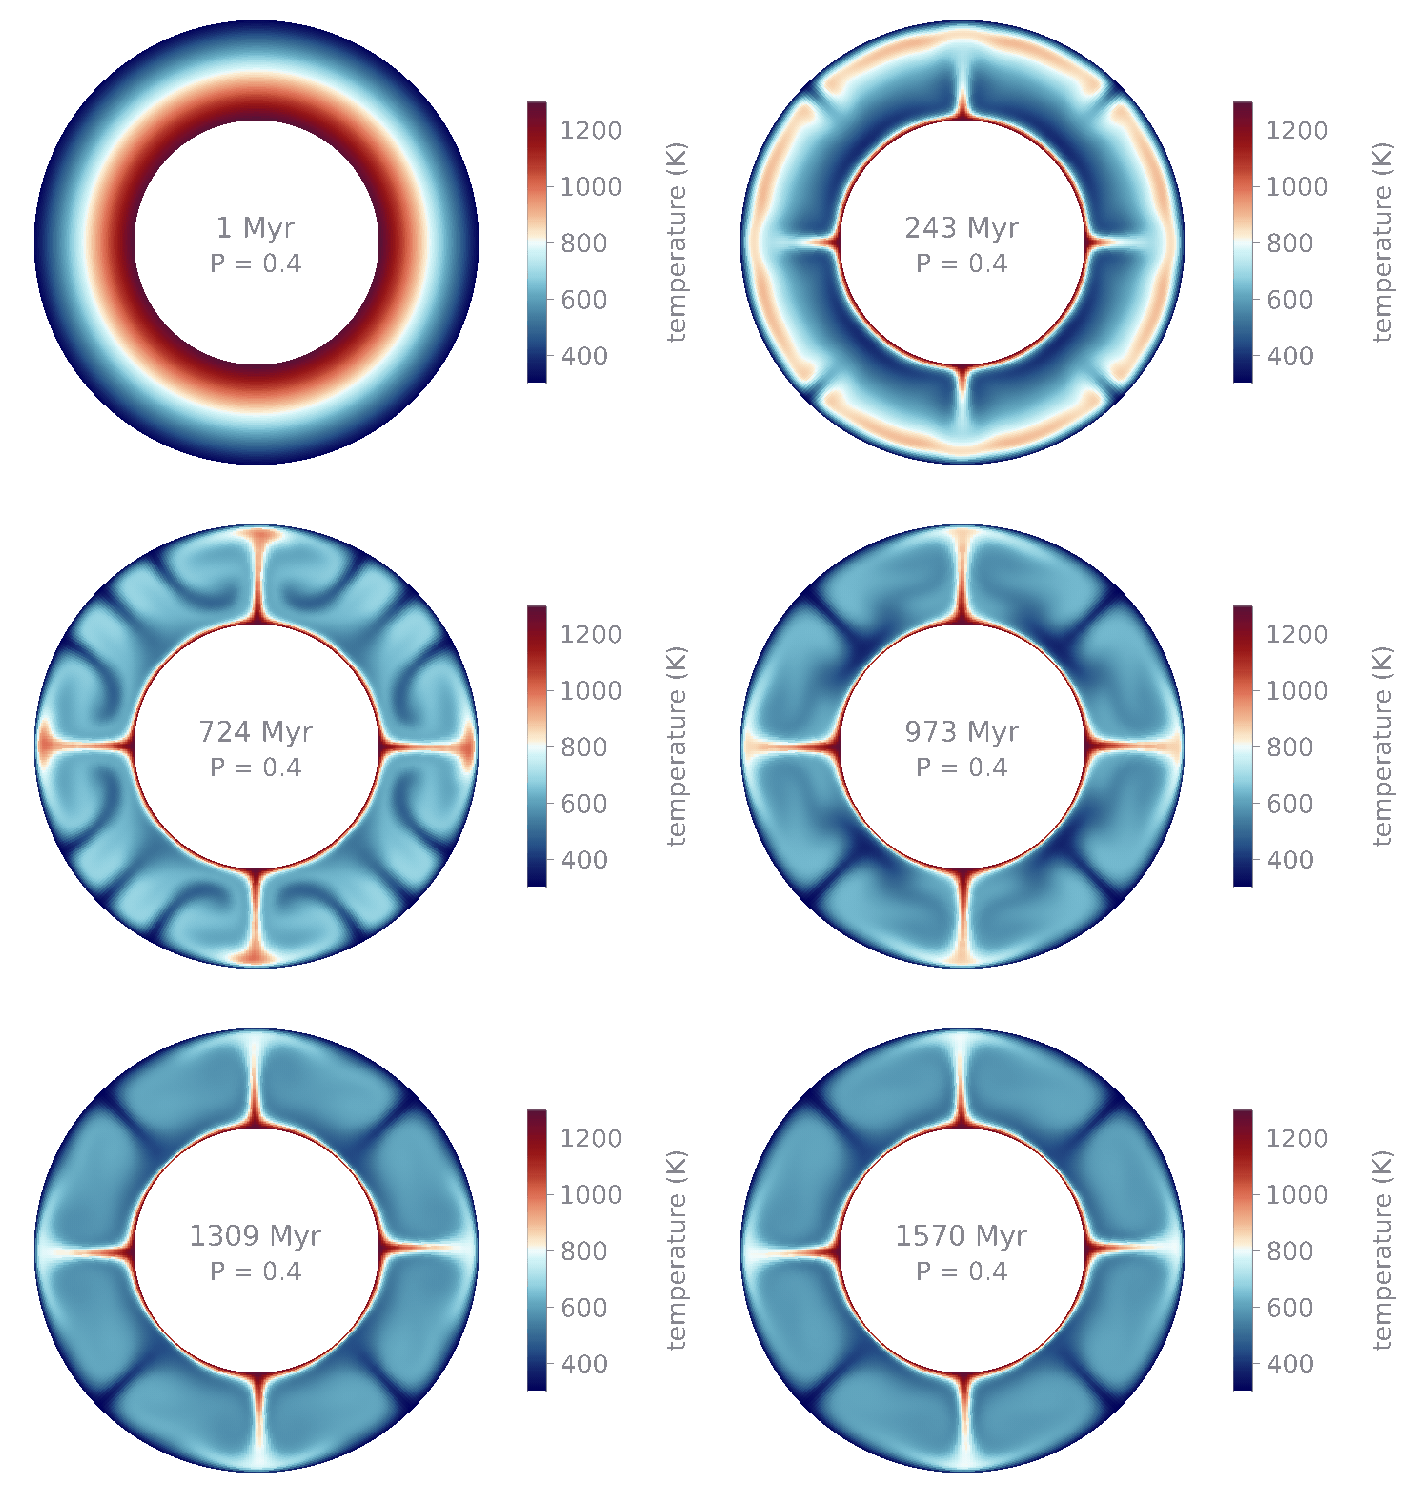
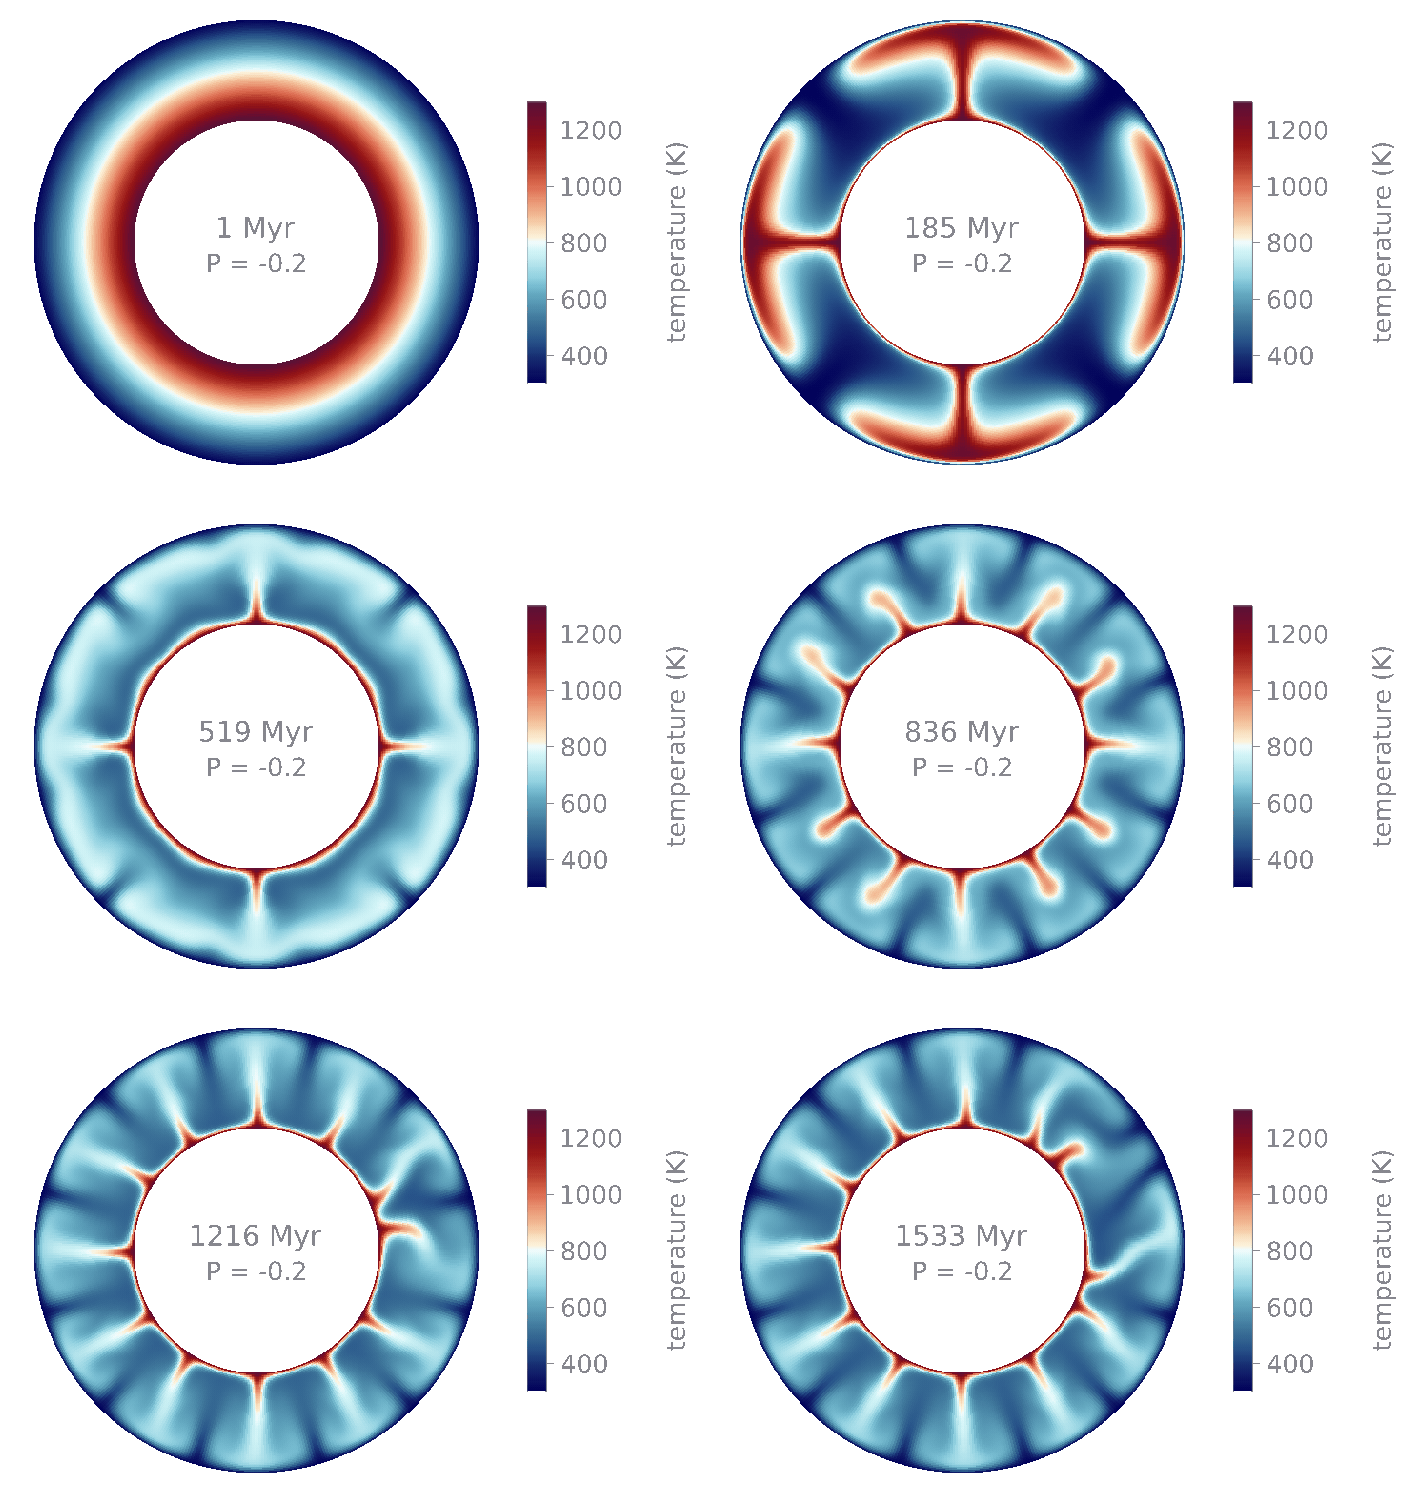
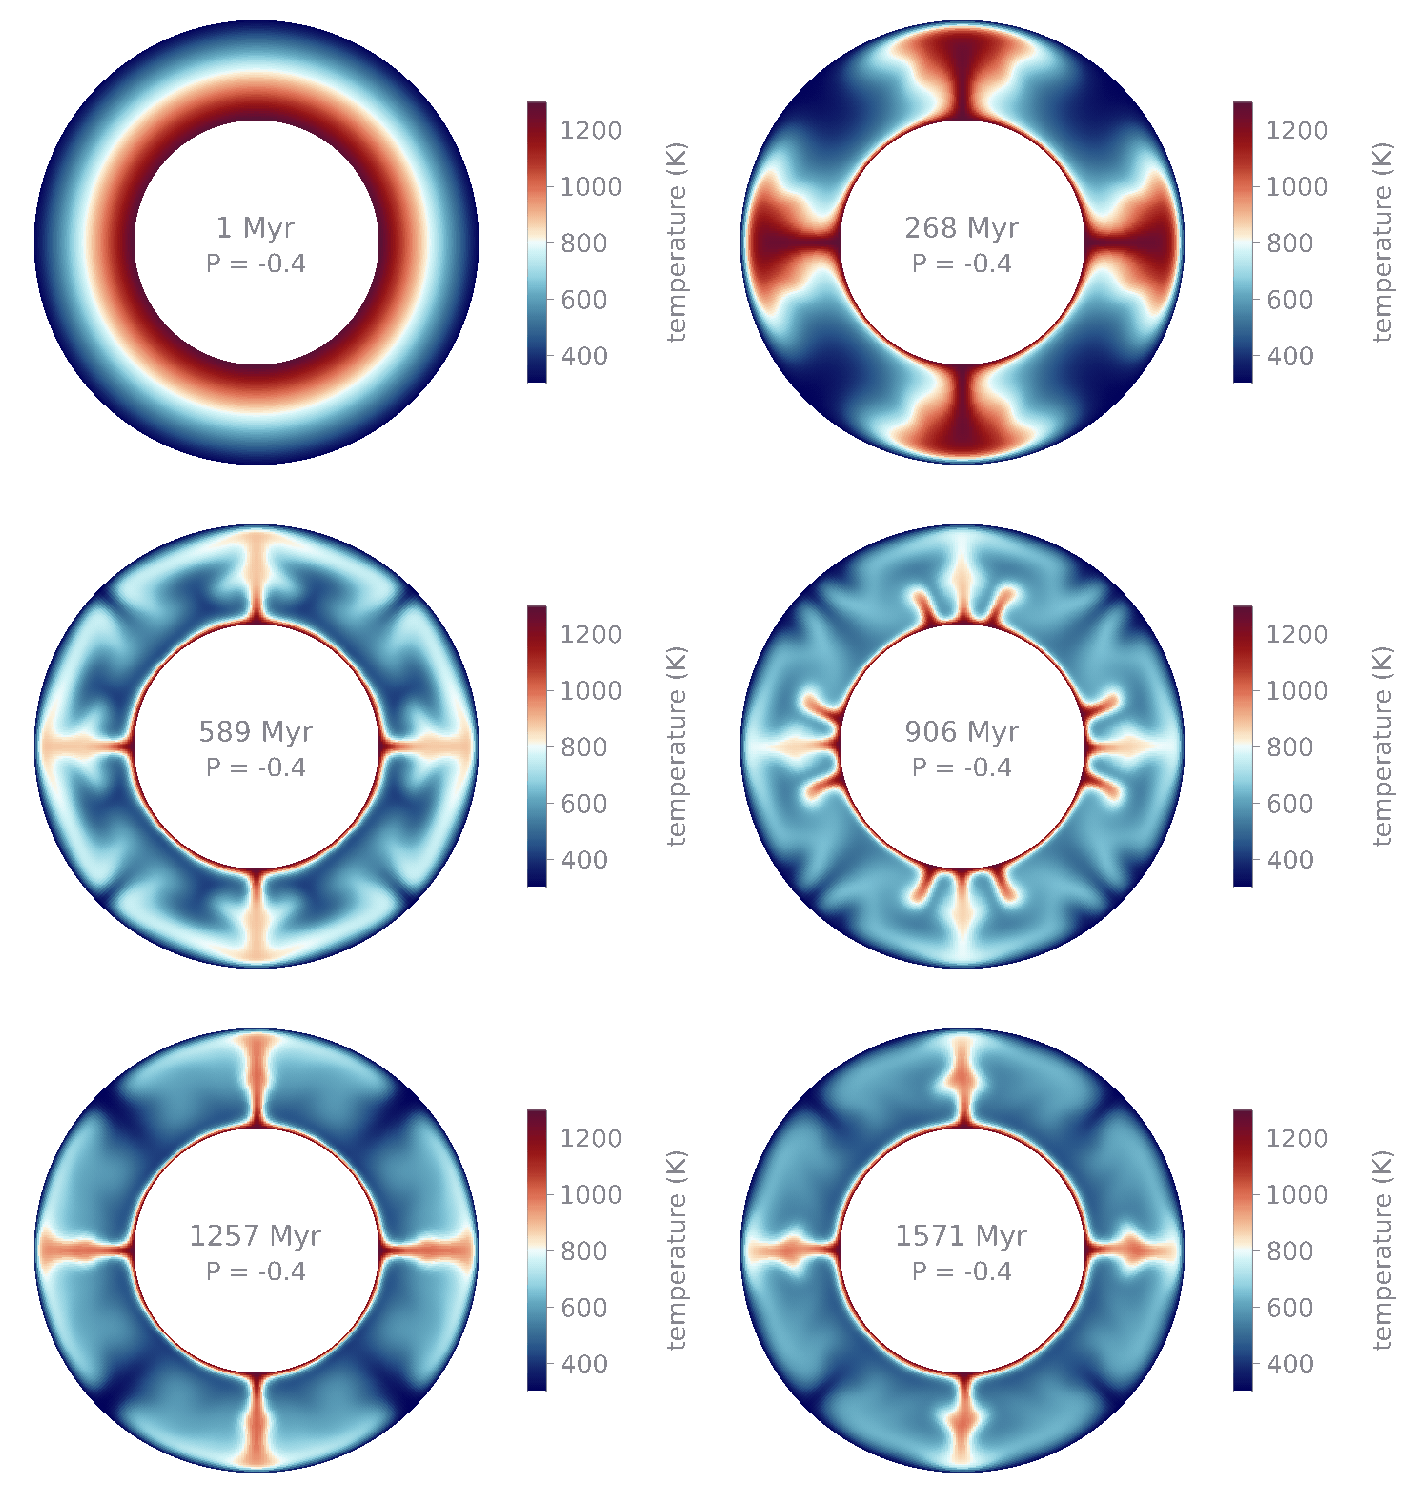
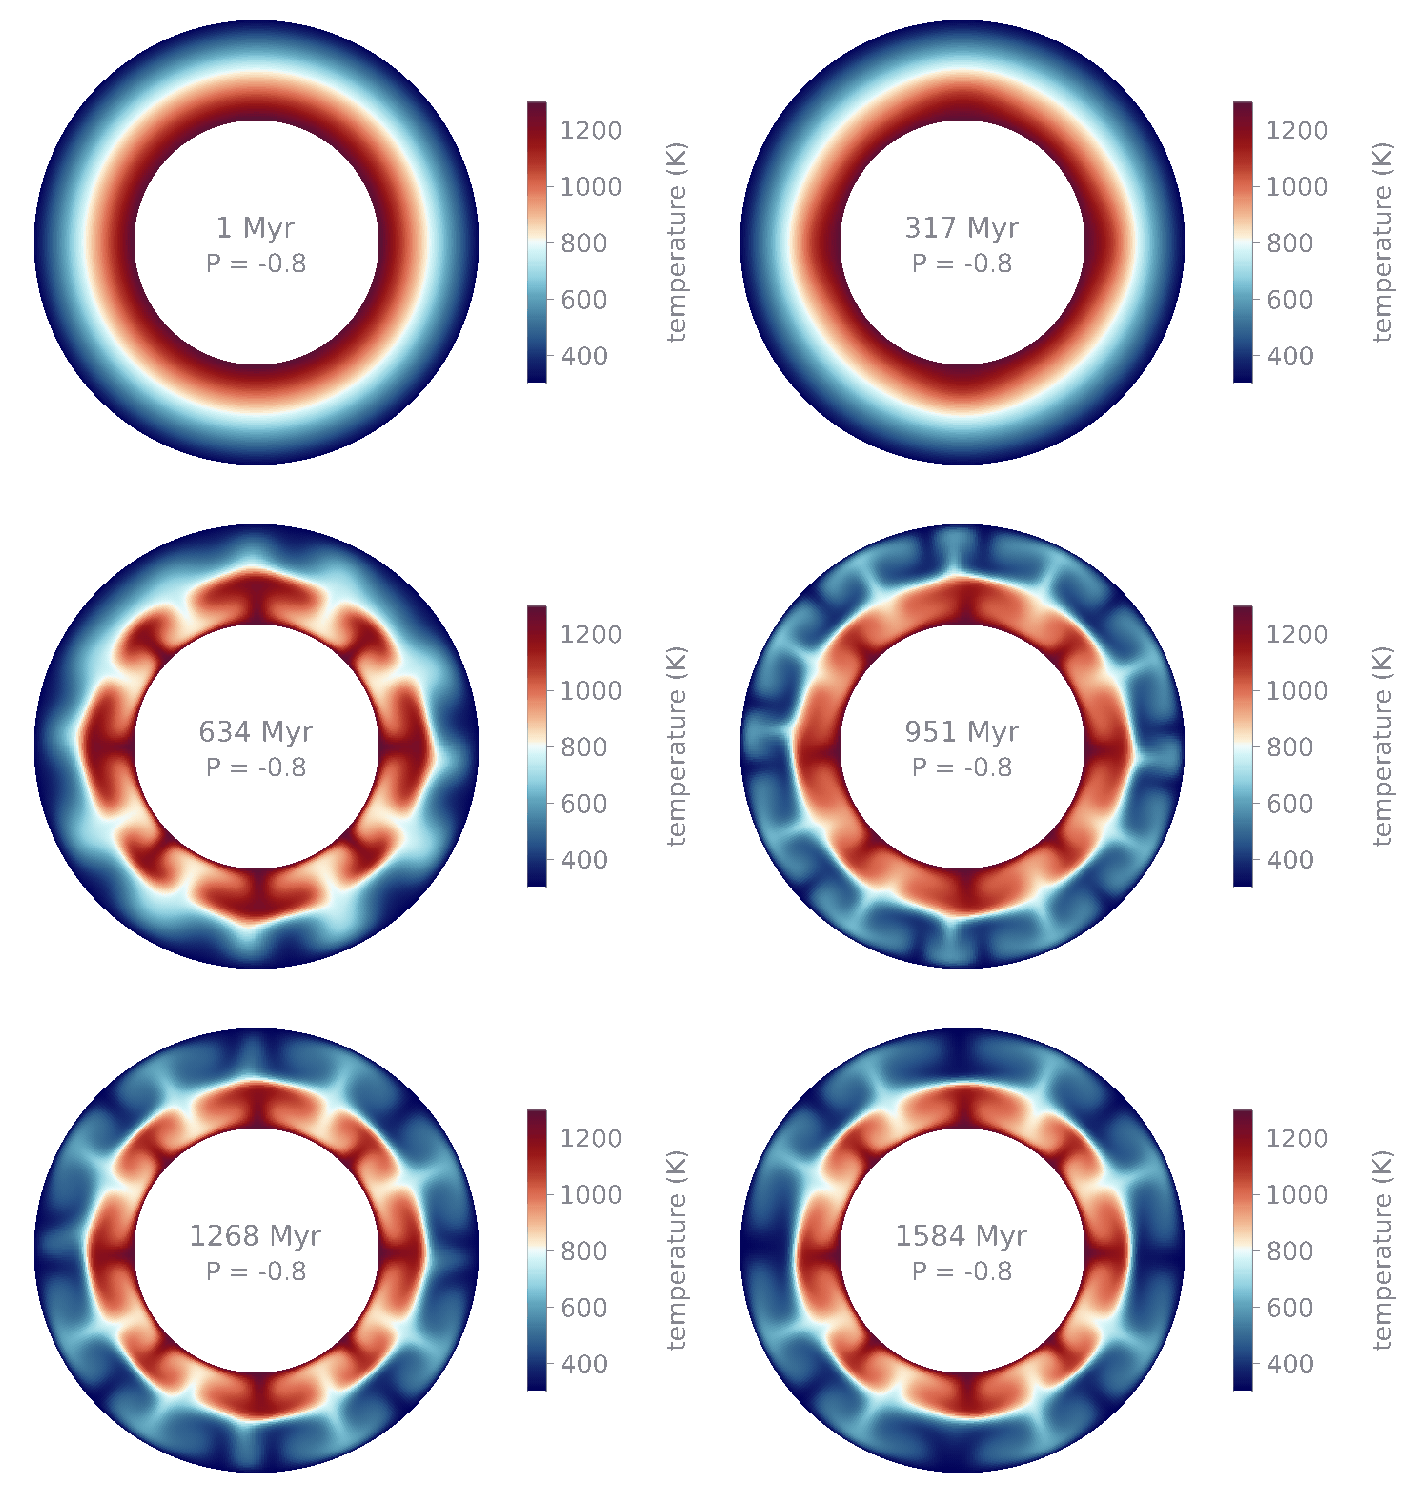
Temperature (300 to 1300 K) of the four runs, Ra = 10⁵, Nr = 64 (64 × 512 cells), to 1585 Myr (0.05 thermal diffusion times). The transition sits at 500 km depth, half way through the 1000 km shell.
The phase transition
The fraction of the high-pressure phase is a smooth step in pressure, shifted by temperature along the Clapeyron slope (Christensen & Yuen 1985):
Here
Two dimensionless numbers measure the effect. The phase Rayleigh number
combines the density jump with the boundary deflection
| +0.4 | −0.2 | −0.4 | −0.8 | |
|---|---|---|---|---|
| +6.47 | −3.24 | −6.47 | −12.95 |
The latent heat of the transition is not included, so the experiment isolates its buoyancy.
Whole-mantle or layered
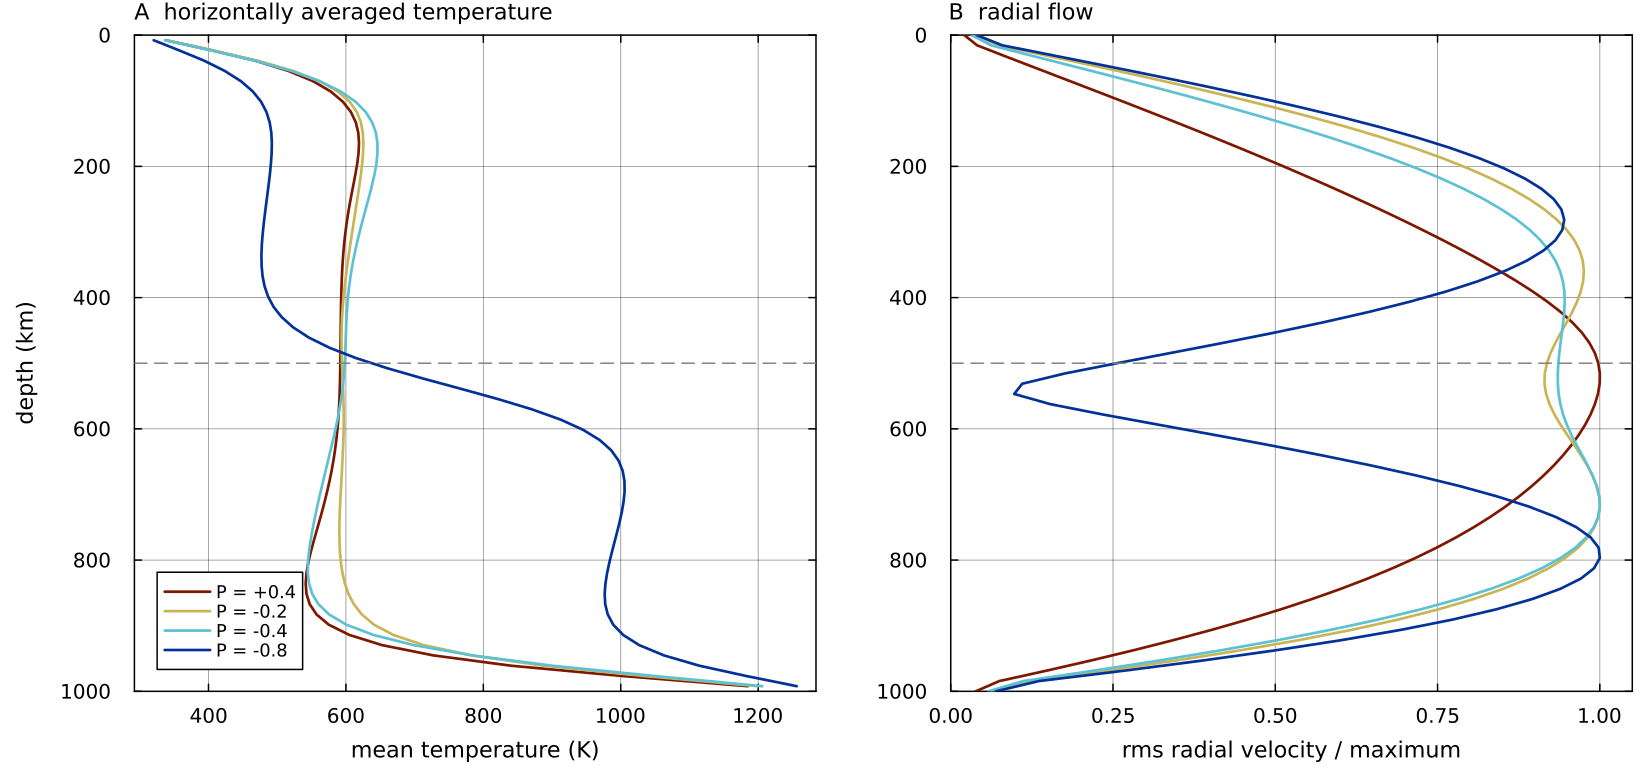
Averages over the last third of each run's frames, computed by docs/scripts/fig_phase_layering.jl. A: horizontally averaged temperature. B: rms radial velocity on each ring of grid nodes, divided by its largest value over depth. Dashed line: the transition depth.
| radial flow at 500 km / maximum | regime | |||
|---|---|---|---|---|
| +0.4 | 1.00 | 8.80 | 0.56 | whole mantle |
| −0.2 | 0.92 | 8.75 | 0.27 | whole mantle |
| −0.4 | 0.94 | 8.65 | 0.34 | whole mantle |
| −0.8 | 0.26 | 4.71 | 0.19 | layered |
Nusselt number and rms velocity: means over the last third of the rows of diagnostics.csv.
With the exothermic transition the radial flow peaks right at the transition and the cells span the whole shell. A weak endothermic transition (
At
The runs are short (0.05 diffusion times), so these are snapshots of the regime, not converged statistics. Where exactly the change to layering happens also depends on
Running it
for p in 0.4 -0.2 -0.4 -0.8; do
  MILEVA_OUTDIR=output/phase_P$p MILEVA_VTKEVERY=100 julia --project=. -t 2 \
      examples/annulus_phase_layering_2d.jl $p 1e5 64
done
julia --project=. docs/scripts/fig_phase_layering.jl output
Arguments are Nr. Each run took 13 to 26 minutes on 2 threads.
References
Christensen, U. R. & Yuen, D. A. (1985), Layered convection induced by phase transitions, J. Geophys. Res. 90, 10291-10300, doi:10.1029/JB090iB12p10291.